We ran one EURUSD long through 16 months of ECB daily rates, with a fixed lot and with a lot resized daily. It concerns anyone planning growth in a compounding calculator.
- A drawdown of 10%, 20%, 30% and 50% needs a gain of 11.1%, 25.0%, 42.9% and 100% to get back to the old high.
- At 3% a month, compounded, a −20% drawdown takes 8 months to recover and a −50% one takes 24.
- From 13 January to 8 June 2010 EURUSD fell 18.0%; the equity of a long worth 3x the starting balance fell 54.0% with a fixed lot and 45.7% with the lot resized daily.
- MetaTrader 5 reports maximum balance drawdown as the largest fall from a local balance high to the next low, in money and in percent, and gives the same for equity.
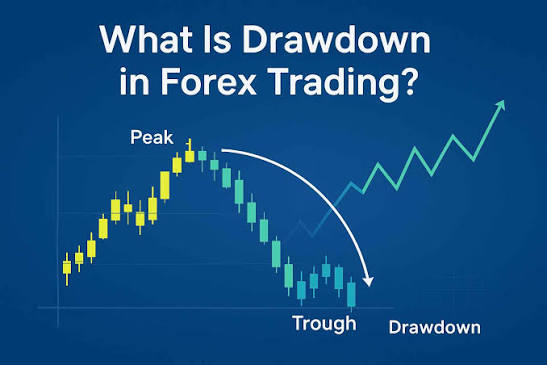
On 21 April 2011 EURUSD was back at 1.4584, above the 1.4563 of 13 January 2010, yet a 3x long that had resized its lot to its equity every day was still 4.1% below its starting equity. Drawdown in trading is the fall of your account from its highest balance or equity to the next low, counted in percent of that high, and the gain you need to get back is always bigger than the loss: −20% takes +25%, −50% takes +100%. You have a compounding calculator open, 3% a month typed in, and the curve climbs in a clean line for 24 months.
That line has no losing month in it. Real accounts do.
The same position with a fixed lot was back in profit that April day, at +0.4%. Why would the account that cut its size after losing come back later than the one that never cut it?
How to recover from drawdown in forex
With a gain of 1 ÷ (1 − drawdown) − 1, earned on the smaller balance. A $10,000 account that drops to $8,000 has lost $2,000, but $2,000 on $8,000 is 25%. The same $2,000 is 20% of where you were and 25% of where you are.
Here’s what that does to time. We took four drawdowns and three steady monthly returns, compounded, and counted the months to get back to $10,000:
| Drawdown | $10,000 becomes | Gain needed | Months at 1% | Months at 3% | Months at 5% |
|---|---|---|---|---|---|
| −10% | $9,000 | 11.1% | 11 | 4 | 3 |
| −20% | $8,000 | 25.0% | 23 | 8 | 5 |
| −30% | $7,000 | 42.9% | 36 | 13 | 8 |
| −50% | $5,000 | 100.0% | 70 | 24 | 15 |
Months rounded up. Calculation by VipTools.
Look at the 1% column. A steady 1% a month needs almost six years to climb out of −50%.
Now put one bad month into a plan. At 3% a month, $10,000 grows to $20,328 in 24 months. Swap one of those months for −20% and the same 24 months end at $15,789. Repairing the −20% takes 8 months at 3%, as in the table; reaching $20,328 takes about eight and a half, because the bad month also didn’t earn its 3%. Have you put that one −20% month into your plan, or only the 3% ones?
Forex compounding: fixed lot or resized lot?
A fixed lot hits harder on the way down; a resized lot slows you on the way back. That’s the answer to the April 2011 question.
We started both accounts with $10,000 on 13 January 2010 at 1.4563, long 0.206 lot, which is a position worth 3x the starting balance. One kept 0.206 lot the whole way. The other was resized at each daily ECB rate so the position stayed at 3x whatever the account was worth. That’s what a compounding plan does, on the way up and on the way down. We marked both at each daily rate with the trade still open, so every figure here is an equity drawdown, the version that counts open trades.
13 January is our entry, not a market peak. EURUSD had topped at 1.5120 on 3 December 2009, and from there to 8 June 2010 the price fell 21.0%.
By 8 June 2010 EURUSD was at 1.1942, down 18.0%. The fixed-lot account was down 54.0%, $4,601 of equity left, still holding a position worth $24,601. Its real leverage had grown from 3x to 5.3x. The resized account was down 45.7%, and its position was worth 54.3% of what it was at the start.
Then price came back, 22.1% from the low to 21 April 2011. The fixed lot needed +117.4% on its equity and got +118.3%, because the full-size position took the whole rebound. The resized account needed +84.3% and got less, because it was climbing with about half the position value. It crossed its starting equity only on 28 April 2011, at 1.4794, when price was 1.6% above where it started.
You probably assumed that compounding works the same in both directions; after the 2010 drawdown the resized account made +76.8% against the +84.3% it needed, because the gain was made on a smaller base with a smaller lot.
Maximum drawdown formula
Maximum drawdown, or max drawdown, is (trough − peak) ÷ peak, taken at the worst peak-to-trough fall in the whole record. MetaTrader 5 prints it in every Strategy Tester report, in money and in percent. Its help page defines the percentage version, Balance Drawdown Relative, as the:
“difference in percentage terms between the highest local balance value and the next lowest account balance value.”
MetaQuotes, MetaTrader 5 Help, “Testing Report”, checked October 2026
The same report has an equity version that counts open trades, and on a leveraged account that’s the one that matters: a margin call doesn’t wait for you to close.
We ran the formula on the full ECB euro reference rate history, January 1999 to 8 October 2026, for a plain long with no leverage. GBPUSD and USDJPY are crosses we worked out from the ECB euro rates. GBPUSD fell 49.7% from 2.1064 on 8 November 2007 to 1.0596 on 28 September 2022. USDJPY fell 43.8% from 134.81 in February 2002 to 75.77 in October 2011 and only regained that high in June 2022, 20.3 years after the peak.
EURUSD has not regained its 15 July 2008 high of 1.5990 by ECB rates. Its maximum drawdown from that high was −40.2%, to 0.9565 on 28 September 2022, a hole that needed +67.2%. On 8 October 2026 it stood at 1.1186, a current drawdown of −30.0%, so a long opened at the 2008 high still needed +42.9% that day, the −30% row of our table. Source: ECB euro reference rates, full history, October 2026.
Forex compounding calculator: where it misleads
A compounding calculator shows what a fixed percentage does over time, and our compounding calculator is the right tool for that sum. The trouble starts when the output is read as a forecast:
- No red months. The formula multiplies by the same 1 + r every period. One −20% month in 24 costs you $4,539 against the clean line at 3%.
- The percentage is always on today’s balance. After a loss the same 3% is 3% of less money, which is exactly what slowed our resized account, and the calculator never sees the loss unless you apply it by hand.
- Leverage isn’t in the formula. An 18% move in price became 54% on a 3x account.
Our position: keep resizing the lot down in a drawdown, even though it slows the way back. On our run the resized account was 4.1% below its starting equity on the day price returned, but at the low it was 8.3 points less deep, and the fixed account was carrying 5.3x leverage on what was left. With the fixed lot, EURUSD at 0.9709, 18.7% under the June low, would have wiped out the $10,000 on paper; in a real account the broker’s stop-out would have closed the trade well before that, with the loss locked in.
Before you trust a compounding plan:
- Run the calculator at your target rate for one month less than your horizon.
- Take your worst real month off that result by hand (for −20%, multiply by 0.8), run the calculator again from the new balance and count the months until it reaches the first plan’s end figure.
- Size each trade off today’s balance with the lot size calculator, not off the high.
What is drawdown in trading?
It’s how far your account has fallen from its last high, in money or in percent, measured on balance (closed trades) or on equity (open trades included). The current drawdown is today’s distance from the high; the maximum drawdown is the worst one in the record.
Our model has limits. ECB rates are one fixing a day, set around 14:10 CET, so the real 2010 lows could only have been deeper than our curves, and we left out spread, commission and swap. We also found no published figure for how deep retail forex drawdowns usually go or how long they last.
Back to the calculator with 3% a month typed in. Run it for 23 months, take 20% off the $19,736 by hand, and month 24 ends at $15,789, not $20,328.
Run your own growth plan
Starting capital, monthly return, horizon. Free, in your browser, no sign-up.