Early Access

Author: admin-viptools

  • Forex Leverage: 1:500 Holds $224 on 1 Lot, Stop Still $400

    Forex Leverage: 1:500 Holds $224 on 1 Lot, Stop Still $400

    Analysis · 9 Oct 2026 · 8 min read

    The EU caps retail leverage on major pairs at 1:30 and the US at 1:50. For anyone who sizes trades from the stop, the setting moves the margin and leaves the loss alone.

    At a glance
    • Margin is the position’s value divided by leverage. On 8 October 2026 one lot of EURUSD was worth $111,860, so 1:50 locked $2,237 and 1:100 locked $1,119.
    • The loss at a stop depends on lot size, stop distance and pip value. One lot of EURUSD pays $10 a pip on a USD account at any setting.
    • ESMA’s 2018 limits, now kept in national rules: 30:1 on major pairs, 20:1 on other pairs and gold, a close-out at 50% of required margin, negative balance protection.
    • In the US, CFTC rule 17 CFR 5.9 sets a minimum deposit of 2% on major pairs and 5% on the rest, which works out to 50:1 and 20:1.

    On 8 October 2026 one standard lot of EURUSD tied up $3,729 of margin at 1:30 and $224 at 1:500, and a 40-pip stop on it cost $400 at both. Forex leverage is the ratio between the size of your position and the margin the broker holds for it: at 1:30 you put up 3.33% of the position’s value, at 1:500 you put up 0.2%, and the pip value and the loss at your stop are set by lot size and stop, not by leverage. You’re filling in the account form, the leverage box offers 1:30 to 1:500, and your cursor hovers as if it decided how much the next trade can hurt.

    On a trade you sized from the stop, it doesn’t. The broker sets aside a smaller deposit, the free margin figure gets bigger, and nothing else on the order ticket moves.

    Yet ESMA cut retail leverage on major pairs to 30:1 in 2018, after national regulators found that 74% to 89% of retail CFD accounts lose money. If the loss at the stop is the same at 1:30 and 1:500, what exactly does the cap take away?

    011:30 vs 1:100

    Which leverage is better, 1:30 or 1:100?

    For a trader who risks a fixed share of the balance per trade, neither: both give the same position, the same pip value and the same loss at the stop. Only the margin locked while the trade is open differs.

    We took the ECB reference rates for 8 October 2026 (EURUSD 1.1186, GBPUSD 1.3207, USDJPY 158.28 worked out from them) and divided one lot’s value by each ratio:

    • EURUSD: $3,729 at 1:30, $2,237 at 1:50, $1,119 at 1:100, $224 at 1:500. Loss at a 40-pip stop: $400.
    • GBPUSD: $4,402, $2,641, $1,321 and $264. Loss at a 40-pip stop: $400.
    • USDJPY: $3,333, $2,000, $1,000 and $200, because the position is counted in dollars from the start. Loss at a 40-pip stop: $252.72.

    Across each line the deposit falls almost 17 times from 1:30 to 1:500 and the stop doesn’t move a cent. The yen stop is cheaper because one pip on one lot of USDJPY is 1,000 yen, which at 158 yen to the dollar is $6.32, not $10.

    When you last changed your ratio, were you watching the margin line or the stop line?

    02Deposit formula

    How to calculate margin in forex

    Multiply lots by contract size and price, divide by leverage, convert to your account currency. For one lot of EURUSD on a USD account at 1:30 that’s 1 × 100,000 × 1.1186 ÷ 30 = $3,729.

    The loss at a stop has its own formula, with no ratio in it:

    Loss = lots × stop in pips × pip value of 1 lot

    So a forex margin calculator tells you whether the platform will accept the order, and a position size calculator tells you what the order costs if the stop is hit. Our lot size calculator does the second: balance, risk and stop in, position size out. Put that size into the margin formula above and you have the deposit too.

    Three accounts, each risking 1% on a 40-pip EURUSD stop:

    AccountSize at 1% riskLoss at 40 pipsMargin at 1:30Margin at 1:500Largest size at 1:30Largest size at 1:500
    $2,0000.05$20$186$110.548.94
    $10,0000.25$100$932$562.6844.70
    $50,0001.25$500$4,661$28013.41223.49

    Source: ECB euro reference rates, 8 October 2026; calculation by VipTools. Spread, commission and swap not included.

    The answer

    Take the $10,000 row. The planned trade loses $100 at 40 pips under any setting; only the last two columns change. At 1:30 the biggest position the platform will open is 2.68 lots, and 40 pips against it costs $1,073, or 10.7% of the balance. At 1:500 the ceiling is 44.70 lots: on paper 40 pips against it costs $17,879, or 178.8% of the balance; in practice the account is gone after 22.4 pips, and the 50% close-out fires after about 11. The cap leaves the trade you planned alone and shrinks the largest trade you can open in a hurry from 44.70 lots to 2.68.

    Question for you

    Have you fixed a “not enough money” message by raising the ratio instead of cutting the lot? On the $2,000 row it comes at 0.54 lots on 1:30, and on 1:500 not until 8.94.

    03Picking a ratio

    What leverage should I use in forex?

    Our position

    We’d take the lowest leverage on which your normal trade opens with room to spare, and on EURUSD with any stop wider than a few pips that is 1:30. A 1% risk with a 40-pip stop locks 9.3% of the balance as margin at 1:30, whatever the balance: $186 of $2,000, $932 of $10,000.

    The limit only bites on very tight stops: a 1% trade would need the whole balance as collateral at 1:30 with a stop under 3.73 pips, at 1:50 under 2.24. Above that, extra gearing is room only a slipped finger on the volume box will use.

    The case for more leverage is about free margin. On $10,000 the 0.25-lot trade leaves $876 more of it at 1:500 than at 1:30, which matters if you hold several positions at once. The $100 at the stop stays exactly where it was.

    20102014201820222026$200$400$1,000$2,000$4,000$8,0001:30 EU$3,7291:50 US$2,2371:100$1,1191:500$224Loss at a 40-pip stop: $400 at every leverage4 May 2011: EURUSD 1.48821:30 holds $4,96128 Sep 2022: EURUSD 0.95651:30 holds $3,188Margin moved, the stop did notMargin for 1 lot of EURUSD at four leverage levels vs theloss at a 40-pip stop, daily, Jan 2010 to 8 Oct 2026 (log scale)Source: ECB euro reference rates (one fixing a day, 14:15 CET), 4 Jan 2010 to 8 Oct 2026.Margin = 100,000 x EURUSD / leverage, in USD. Limits: ESMA 2018 (30:1 majors), CFTC 17 CFR 5.9(2% majors). Calculation by VipTools, 9 Oct 2026. Spread, commission and swap not included.

    Where the margin number misleads you:

    • It isn’t fixed in dollars. At the same 1:30, one lot of EURUSD needed $4,961 on 4 May 2011, at an ECB rate of 1.4882, and $3,188 on 28 September 2022, at 0.9565. On the chart four margin lines drift with the euro while the $400 stop stays flat. At 1:500 it never topped $298 since 2010, less than one stopped-out trade.
    • The stop belongs to the pair. USDJPY at 1:30 needs $3,333 against $3,729 on EURUSD, and its 40-pip stop is $252.72 against $400.
    • The broker has its own stop. ESMA’s close-out sits at 50% of the required deposit: on $10,000 with one lot at 1:30, $1,864 of equity, about 814 pips away.
    • A stop can be jumped. ESMA’s FAQ points to January 2015, when the euro fell suddenly against the Swiss franc and some retail clients without negative balance protection ended up owing their providers very large sums, often much more than they could afford. The bigger the position, the further past zero a gap goes.
    04EU & US caps

    What is the maximum forex leverage in the EU and US?

    In the EU it’s 30:1 on major pairs for retail CFD clients and 20:1 on other pairs, gold and major indices. ESMA’s major pairs combine any two of the dollar, euro, yen, pound, Canadian dollar and Swiss franc. The measures, listed in the ESMA press release of 27 March 2018, applied from 1 August 2018. ESMA let them expire on 31 July 2019 because most national regulators had made permanent rules at least as strict.

    “The new measures on CFDs will for the first time ensure that investors cannot lose more money than they put in, restrict the use of leverage and incentives, and provide a risk warning for investors.”

    Steven Maijoor, then ESMA Chair, ESMA press release, 27 March 2018
    Important

    in the US the floor is written as a deposit, not a ratio. CFTC rule 17 CFR 5.9 requires at least 2% of the notional value on major pairs and 5% on all others, which is 50:1 and 20:1. NFA sets the actual rate; its guide gives EUR/USD at 2% and notes changes to the minimums in January 2015, November 2016 and September 2018. Source: eCFR, 17 CFR 5.9, and NFA Forex Transactions Regulatory Guide, checked October 2026.

    What we couldn’t find is how close retail traders trade to these ceilings: ESMA’s 2018 papers give loss rates, not position sizes.

    05Basics

    What is leverage in forex?

    Leverage in forex is borrowed exposure: at 1:30 each dollar of collateral controls $30 of currency, at 1:500 it controls $500. Margin is a deposit held while the trade is open, not a fee, and it comes back when you close.

    Free margin is the equity left after that deposit; it shrinks as you add trades or a trade goes against you.

    Back to the account form. Whatever you pick in the ratio box, the 0.25-lot trade on $10,000 still loses $100 at 40 pips; the box only decides whether the platform would also open 44.70 lots, a position that empties the account in 22.4 pips.

    Size your next trade

    Account, risk and stop in, position size out. Free, in your browser, no sign-up.
    Open the lot size calculator →
    How we checkedWe opened ESMA’s press releases of 27 March 2018, 1 June 2018 and 31 July 2019 and its FAQ ESMA71-98-125, 17 CFR 5.9 on eCFR, NFA’s Forex Transactions Regulatory Guide and the ECB euro reference rates from 2010 to 8 October 2026; we calculated margin at four leverage levels, the loss at a 40-pip stop and the largest position each ratio allows, on one ECB fixing a day; we did not find data on retail position sizes against the leverage ceiling. What is established: ESMA retail limits of 30:1 on major pairs and 20:1 on others, with a 50% close-out; a US minimum deposit of 2% on major pairs and 5% on others; one lot of EURUSD needed $3,729 at 1:30 and $224 at 1:500 on 8 October 2026, with $400 lost at 40 pips at both. Not in the open: how close retail traders trade to their leverage ceiling. Data current as of October 2026.
    Risk warningEducational information only, not investment advice. Trading leveraged products carries a high risk of losing money.
  • ATR Stop Loss: 20-Pip EURUSD Stops Were Hit on 64% of Days

    ATR Stop Loss: 20-Pip EURUSD Stops Were Hit on 64% of Days

    Analysis · 9 Oct 2026 · 8 min read

    On EURUSD since 2020, a stop at 1.5 times daily ATR ranged from 64 to 234 pips. If you risk a fixed 1% a trade, your position size has to move across that same range.

    At a glance
    • ATR(14) is the average true range of the last 14 bars: each day’s high to low, stretched to the previous close when the market gaps, smoothed with Wilder’s formula.
    • The wider the multiple, the rarer the hit: since 2020 a EURUSD stop at 2 times the previous day’s average range was reached before the close in 0.7% of sessions, and at 3 times once in 1,767 sessions.
    • On 8 October 2026 a stop at 1.5x the range was 94 pips, and 1% of a $10,000 account bought 0.10 lot, $94 at risk. A fixed 20-pip stop buys 0.50.
    • An ATR trailing stop follows the best price since entry at a set multiple of the range, often 3, and moves only in the trade’s favour.

    Since January 2020, a 20-pip stop under a EURUSD long opened at the day’s open was hit before the close on 64% of days; a stop at 1.5 times daily ATR, on 2.7% (UTC daily candles, spread not counted). An ATR stop loss sets the stop distance as a multiple of the Average True Range, usually the 14-day version, and the position size follows from that distance so the loss at the stop stays at your fixed 1%. You have $10,000, a EURUSD long in mind, and an empty stop-loss field in the order ticket.

    A twenty-pip cushion feels safe: half a lot, $5 a pip. But the median EURUSD session since 2020 travelled 69.6 pips from high to low, so a 20-pip stop gets touched by noise, not by the idea being wrong.

    One day in April 2025 the wider stop failed the other way: the price ran far past it. So what did the 1% rule cost that day?

    01Volatility stops

    How to use ATR for stop loss

    Read ATR(14) on your timeframe, multiply it by 1.5 to 3, and put the stop that far from entry. Then size the position from that distance, not the other way round.

    We tested each width on 1,767 daily EURUSD candles from Alpha Vantage, cut at UTC midnight, holiday bars included. Each day we placed a long at the open and checked whether the low reached the stop by the close, or within five sessions. Spread isn’t counted; it would add hits to tight stops first:

    • Fixed 20 pips: hit the same day 63.6% of the time, within five sessions 84.1%.
    • Fixed 60 pips: 19.8% the same day, 55.6% within five sessions.
    • 1.5x the previous day’s ATR: 2.7% the same day, 27.6% within five sessions.
    • 2x ATR: 0.7% the same day. 3x: once in 1,767 sessions.

    Shorts look the same: a 20-pip distance above the open was reached on 64.2% of days.

    Did the stop on your last trade come from the chart, or from the size you wanted to trade?

    The tightest of these 1.5x stops in six years was 64.25 pips, set for 31 January 2020. Half were wider than 111.

    02Position sizing

    ATR position sizing: 20-pip vs 60-pip stop on one 1%

    Same formula as for any stop:

    Lot = (account × 1%) ÷ (stop in pips × pip value of 1 lot)

    On EURUSD with a USD account one lot pays $10 a pip. With a volatility stop the distance changes every day, so the size changes with it:

    Stop on EURUSDStop, pips$2,000$10,000$50,000
    Fixed at 20200.100.502.50
    Fixed at 60600.030.160.83
    1.5x ATR at the 30 Jan 2020 close64.30.030.150.77
    1.5x ATR at the 8 Oct 2026 close94.40.020.100.52
    1.5x ATR at the 27 Mar 2020 close234.4below 0.010.040.21

    Position sizes at 1% risk, rounded down to 0.01. Source: Alpha Vantage daily EURUSD candles; Wilder ATR(14); calculation by VipTools.

    Common assumption

    You probably assumed a wider stop means a bigger loss; at 0.10 lot, the 94-pip stop costs $94, against $100 for 0.50 on a 20-pip stop. What really changes is the number in the volume box, and how often you pay.

    Now the day from April. On 2 April 2025 EURUSD’s ATR was 83.4 pips, so a 1.5x stop was 125 and 1% of $10,000 bought 0.07 lot. On 3 April the pair opened at 1.08262 and reached 1.11466, a 320-pip climb, 2.56 times the stop. A short filled at its stop would have lost $87.53, under 1% because of rounding. The price ran another 195 pips; the loss stayed where the 0.07 size had put it.

    050100150200250300350Stop = 1.5 × ATR(14), pipsfixed 60-pip stopfixed 20-pip stopUSDJPYEURUSD27 Mar 2020234 pips26 Jul 2024: 6711 Apr 2025209 pips8 Oct: 94202020212022202320242025202620270.000.050.100.150.20Lot for 1% of $10,00060-pip stop: 0.16 lot (20-pip stop: 0.50, off the scale)27 Mar 2020: 0.0430 Jan 2020: 0.1526 Jul 2024: 0.140.10USDJPYEURUSDSame 1% risk, a lot that never sits stillEURUSD and USDJPY: a stop at 1.5 × daily ATR(14) (top) andthe lot that keeps it to 1% of $10,000 (bottom), 2020 to 2026Source: daily OHLC, Alpha Vantage FX_DAILY (EURUSD) and Twelve Data (USDJPY),1 Jan 2020 to 8 Oct 2026 (USDJPY to 7 Oct), UTC days. Wilder ATR; USD account, pip valueat each close; labels rounded down to 0.01. Calculation by VipTools, 9 Oct 2026. Spread not included.

    In late January 2020 the size for 1% was 0.15 lot; by 27 March the stop had widened to 234 pips and the position had fallen to 0.04. Counted in pip terms, USDJPY’s average range was wider than EURUSD’s 74.2% of the time; on 7 October 2026 its 1.5x stop was 171.5 pips, or 0.09 lot on $10,000.

    Put the day’s stop into the lot size calculator before you place the order.

    03Weak spots

    Where the ATR stop loss misleads

    On real data the rule leaks in four places:

    1. It lags. The average looks back 14 sessions. On 3 April 2025 the day’s true range was 342 pips, 4.1 times the previous day’s reading, so the stop was sized for a market that no longer existed.
    2. Your feed changes the number. Our ATR(14) from Alpha Vantage and Twelve Data differed by 4.0 pips on an average day; on 3 April 2020, 146 against 168.
    3. A close-only series halves it. The ECB’s euro rate is one number a day, with no high and no low. Used as a stand-in, its average absolute daily change over 14 sessions came to 0.48 of the true figure on EURUSD since 2020; on 8 October 2026 it was 39.6 pips against 63.0.
    4. Small accounts can’t follow it down. On 27 March 2020 a $2,000 account needed 0.0085 lot; the minimum 0.01 put $23.44, or 1.17%, at risk.

    “They are based on the daily concertation procedure between central banks across Europe, which normally takes place around 14:10 CET.”

    European Central Bank, euro foreign exchange reference rates, checked October 2026

    One moment a day can’t show how far the price swung around it.

    Worth knowing

    Alpha Vantage’s FX_DAILY returns open, high, low and close per UTC day, and its free EURUSD history goes back to 9 August 2007. Source: Alpha Vantage API documentation and our download, 9 October 2026.

    Our position

    To be fair to fixed stops: a fixed 111-pip stop, the median width of our volatility stops, was hit the same day 3.6% of the time against 2.7%, and within five sessions on 27.1% against 27.6%. The average range’s gain is that it adapts the width, not that it beats a fixed stop of the same size. Our position: on a daily-chart EURUSD trade, let ATR set the width and let the size shrink to fit. If 1% at that stop gives less than your broker’s 0.01, skip the trade rather than tighten it.

    04Trailing exits

    How does an ATR trailing stop work?

    It keeps the stop a set multiple of the range away from the best price since entry and moves only one way. Defaults differ: one platform we checked uses a 21-day ATR times 3, another leaves both to you.

    Our rule: the stop sits 3 times ATR(14) below the highest high since entry, is reset at each close, and is hit when the next day’s low touches it (filled at the stop, or at the open on a gap). We ran it on a EURUSD long from the close on 28 February 2025, at 1.03747. The first stop sat 180.4 pips away, so 1% of $10,000 bought 0.05 lot. The trail rode the April rally and was hit on 8 May 2025: 876 pips, $438, 4.9 times the risk.

    One good start proves little, so we started the same trail on every session since 2020, long and short: 3,491 trades closed, and 43 were still open on 8 October 2026, so we left them out. The average closed trade made minus 0.006 of its risk before spread, roughly zero, and the median lasted 16 days. The best made 11.9 times its risk, but 62.4% closed at a loss.

    What we couldn’t measure is the fill: daily candles show where a stop was touched, not the price a broker gave on days like 3 April 2025.

    05Average true range

    What is ATR in trading

    ATR, the Average True Range, is J. Welles Wilder’s measure of how far a market moves in a bar, described in his 1978 book New Concepts in Technical Trading Systems. True range is the largest of three gaps: today’s high to low, today’s high to yesterday’s close, today’s low to yesterday’s close. Wilder’s 14-bar version is (yesterday’s value × 13 + today’s true range) ÷ 14, and says nothing about direction.

    On EURUSD a reading of 0.0063 is 63 pips. On 9 September 2026 EURUSD’s daily ATR was 45.5 pips; by 8 October it was 63.0, and the same trade idea needed a wider stop and a smaller position. On 8 October that meant 94 in the stop-loss field and 0.10 in the volume box, for $94 at risk, where a 20-pip distance and 0.50 lot would have put $100.

    Size your next trade

    Account, risk and stop in, position size out. Free, in your browser, no sign-up.
    Open the lot size calculator →
    How we checkedWe opened Alpha Vantage’s FX_DAILY documentation, downloaded daily EURUSD candles from it and EURUSD and USDJPY candles from Twelve Data (both through public demo keys, UTC days), the ECB euro reference rates and its page on how they are set, and two charting platforms’ references for volatility trailing stops; we calculated Wilder ATR(14), hit rates of fixed and range-based stops from 1 January 2020 to 8 October 2026, position sizes at 1% risk and a 3x trailing stop with an intraday exit started on every day; we did not find any broker’s record of real stop fills. What is established: true range uses the prior close, the 14-bar average is Wilder-smoothed, and on EURUSD since 2020 a 1.5x stop of this kind was hit the same day 2.7% of the time against 63.6% at a fixed 20-pip width and 3.6% at a fixed 111 pips. Not in the open: the prices at which stops were actually filled on fast days. Data current as of October 2026.
    Risk warningEducational information only, not investment advice. Trading leveraged products carries a high risk of losing money.
  • XAUUSD Pip Value for 0.01 Lot: $0.10 or $0.01, $227 a Month

    XAUUSD Pip Value for 0.01 Lot: $0.10 or $0.01, $227 a Month

    Analysis · 9 Oct 2026 · 9 min read

    The smallest gold order at the MetaTrader brokers we checked is one troy ounce, about $4,300 of metal in September 2026. Sized the way you’d size EURUSD, it can risk several times your 1%.

    At a glance
    • At RoboMarkets (Pro account, RoboMarkets Deutschland) and Eightcap one lot of XAUUSD is 100 troy ounces and the minimum order is 0.01, so a 0.01 position is one ounce and pays $1 for every $1 the price moves.
    • Pepperstone lists the XAUUSD pip value at $0.10 per 0.01 lot, which on a 100-ounce contract would mean a $0.10 price step; RoboMarkets sets the pip size at 0.01, so there the same position pays $0.01 for each cent of price.
    • Gold averaged $4,319 an ounce in September 2026 by World Bank data, so a 0.01 position held $4,319 of metal against $1,151 for 0.01 lot of EURUSD.
    • In the 12 months to September 2026 gold’s average monthly move (the change between consecutive monthly average prices, averaged over 12 months) was worth $227 on a 0.01 position; on EURUSD it was $11.62.

    A 0.01 position in gold pays $0.10 a pip at Pepperstone, the same as 0.01 lot of EURUSD, yet in the year to September 2026 an average month moved it by $227 and the euro trade by $11.62. XAUUSD pip value for 0.01 lot is $1 for each $1 change in the gold price, because a standard contract is 100 troy ounces at the MetaTrader brokers we checked and 0.01 of it is one ounce; how many “pips” that dollar contains depends on how your broker defines one. You’ve moved over from EURUSD, the order ticket says 0.01, the column next to it says $0.10, and it looks like the trade you already know.

    It isn’t. The dime matches, but here it buys a ten-cent move on a $4,300 price, and an average month of the past year held 2,274 of those. Then there’s a second puzzle. A 0.01 position in the metal holds only 3.75 times as many dollars as 0.01 lot of EURUSD, yet it swung about 20 times as many dollars a month. Where does the rest come from?

    01Gold micro order

    What is the XAUUSD pip value for 0.01 lot?

    It’s $0.10 if your broker counts a $0.10 price change as one pip, and $0.01 if it counts $0.01. In dollars per dollar of price it’s always $1, as long as the contract is 100 ounces.

    Pepperstone publishes its figures in a pip value guide: XAUUSD at $10 per standard lot, $1 at 0.1 and $0.10 at 0.01. RoboMarkets Deutschland’s XAUUSD specification for its Pro account lists “1 Pip Size 0.01” and “Size of 1 lot 100 oz.” Pepperstone’s table doesn’t state the contract size; if it is 100 ounces too, its pip is a $0.10 move and the two definitions differ by a factor of ten. A trader who opened accounts at two brokers ran straight into it:

    “On pepperstone for example it says on their website that a 1 pip move at 0.01 lots is equal to $0.10. But with my current broker (HFM) I traded XAUUSD and it came out to be $7.2 for a 720 pip move.”

    Shiaav01, Babypips forum, 3 October 2024
    Our position

    The numbers are consistent with a $7.20 price move on a 100-ounce contract: 720 pips if each is $0.01, 72 if each is $0.10. Our position: on gold, stop counting in pips. Count the stop in dollars of price, because that number stays the same at every broker using 100-ounce contracts, and the number of pips doesn’t.

    We took the World Bank’s monthly gold averages and the ECB’s daily euro rates, averaged by month, and measured the change from one monthly average to the next in dollars for a 0.01 position. Each point on the chart is the mean of those changes over the trailing 12 months:

    201020122014201620182020202220242026$0$50$100$150$200$250Gold (XAUUSD)0.01 lot = 1 troy ozEURUSD, 0.01 lot = €1,000Dec 2010: EURUSD$40 vs gold $35Dec 2019: gold $32,EURUSD $6.46Aug 2026: gold $245,EURUSD $12(21×)What one month moves 0.01 lotAverage monthly move in dollars, trailing 12 months,gold vs EURUSD, Jan 2010 to Sep 2026Source: World Bank Pink Sheet (gold, monthly average $/troy oz, Oct 2026 release);ECB euro reference rates (monthly averages of daily USD rates). Move = change betweenconsecutive monthly averages, so intramonth swings are larger. Calculation by VipTools.

    In the year to December 2010 the euro still had the bigger swing: $40 a month on 0.01 lot of EURUSD against $35 on an ounce of gold. Over the following 15 years the two lines split. In December 2019 the euro was at $6.46 and gold at $32. Then the metal went to the highest monthly average in the World Bank series back to 1960, $5,020 in February 2026, and by August 2026 its average monthly move was $245 against the euro’s $12.

    Question for you

    Did your last gold stop come from the chart, or from the number of pips you used to set on EURUSD?

    02Gold position size

    How to calculate lot size for gold

    Use the same risk formula as forex, but put the stop in dollars of price and the value of one standard contract per dollar, which is $100 at 100 ounces:

    Lot = (account × risk %) ÷ (stop in $ of price × 100)

    We took a EURUSD stop of 20 pips and measured it against the euro’s average monthly move in the year to September 2026, which was 116 pips: 20 pips is 17% of it. The same 17% of gold’s average month is $39 of price. So 20 pips on EURUSD and $39 on XAUUSD ask the same of the market. Here’s what they do to three accounts at 1% risk, rounding down to the 0.01 step and never below 0.01:

    AccountTradeFormula saysYou tradeLoss at stopReal risk
    $500EURUSD, 20 pips0.02500.02$4.000.80%
    $500XAUUSD, $39 stop0.00130.01$39.007.80%
    $2,000EURUSD, 20 pips0.10000.10$20.001.00%
    $2,000XAUUSD, $39 stop0.00510.01$39.001.95%
    $10,000EURUSD, 20 pips0.50000.50$100.001.00%
    $10,000XAUUSD, $39 stop0.02560.02$78.000.78%

    Source: World Bank Pink Sheet (gold) and ECB reference rates (EURUSD), 12 months to September 2026; calculation by VipTools.

    Look at the $500 row. The euro trade fits the rule with room to spare, and the smallest possible XAUUSD order takes 7.8% of the account on a single stop. That $39 is 390 pips at a broker that uses $0.10 and 3,900 at one that uses $0.01. You can run your own numbers in our lot size calculator and check what your broker’s definition does to it in the pip calculator.

    Now the puzzle from the top. Contract size explains only part of the gap: a 0.01 position in the metal held $4,319 in September 2026, 3.75 times the $1,151 in 0.01 lot of EURUSD. The rest is volatility. Over the past year gold’s average monthly move was 5.27% of its price and the euro’s was 1.01%, five times smaller. Multiply 3.75 by that ratio and you get the 19.6 we measured for September 2026.

    Where the formula trips you up on gold:

    • The definition. If your platform’s pip is $0.01 and you type $0.10 from another broker’s table into a calculator, your size is ten times off in one direction or the other.
    • The minimum. Below about $3,900 of balance, a 0.01 position with a $39 stop is already more than 1%, and the formula has nowhere lower to go.
    • The averages. Both month figures come from changes between monthly average prices, so both understate a real month, and 20 pips or $39 is a smaller share of an actual month than 17%. Compare your stop with the high-to-low range inside the month, not with these averages.
    • The contract. 100 ounces is common, not universal, so the $100 in the formula has to come from your own symbol’s specification.
    03Pip definitions

    What is 1 pip in XAUUSD?

    It’s whatever price step your broker names a pip: $0.01 at RoboMarkets, $0.10 at Pepperstone if its contract is 100 ounces, and a full $1 on IG’s own CFD platform. On a 100-ounce contract, a $1 move still makes $1 on a 0.01 position whatever the step is called.

    Worth knowing

    IG’s own CFD platform doesn’t sell the metal in 100-ounce lots. Its dealing details list a minimum size of 0.01, a contract size of USD 1, and “One Pip means 1 $/Troy Ounce”, so there a whole dollar of price counts as a single step and 0.01 of that contract earns one cent per dollar, not one dollar. Source: IG, Spot Gold market page, checked October 2026.

    At the September average, a 1% move in the metal was $43.19 on one ounce, already 8.6% of a $500 account, against $11.51 for a 1% move in 0.01 lot of EURUSD. On the $500 row the trouble is the 0.01 minimum: with a $39 stop the smallest order can’t come down to 1%.

    Question for you

    Have you checked which digit your own platform calls a pip on XAUUSD? It takes a minute:

    1. Open the symbol’s specification in MT4 or MT5 and read the contract size. If it’s 100, a 0.01 order is one ounce.
    2. Read the digits. Two digits after the point means a tick is $0.01; whether a pip is $0.01 or $0.10 is in the broker’s own spec page.
    3. Measure your stop in dollars of price, then put that figure into the lot size calculator, not a count of pips.

    We couldn’t measure the high-to-low range inside each month for the metal. The free daily sources we tried, the London bullion market’s price feed, FRED and the Bundesbank, were blocked or returned no data, so the chart uses the World Bank’s monthly averages. On both markets the range inside a month is wider than the move between two monthly averages, so stops of $39 and 20 pips sit tighter against a real month than the 17% suggests.

    04Contract specs

    What is the XAUUSD contract size?

    At the MetaTrader brokers we checked it’s 100 troy ounces per standard lot. Eightcap’s commodities table lists XAUUSD with a contract size of 100 and a minimum volume of 0.01; RoboMarkets Deutschland lists “100 oz.” on its Pro account with a minimum of 0.01 and a step of 0.01. So 0.1 lot is 10 ounces and $10 per $1 of price, and 0.01 is one ounce and $1.

    Back to the order ticket. That column still says $0.10. Next to it, write the dollar distance to your stop, because on a 0.01 gold position that’s the loss: $39 on the stop we used, and $227 in an average month of the past year.

    Check the pip on your pair

    Today’s pip value for any pair and account currency. Free, in your browser, no sign-up.

    Open the pip calculator →
    How we checkedWe opened the XAUUSD specifications of RoboMarkets Deutschland (Pro account) and Eightcap, Pepperstone’s pip value table, IG’s Spot Gold dealing details for its own CFD platform, the World Bank Pink Sheet monthly data (October 2026 release) and the ECB euro reference rates to 8 October 2026; we calculated monthly moves at 0.01 from monthly averages and sized three accounts at 1% risk; we did not find a free daily bullion price series we could download. What is established: 100 troy ounces per lot and a 0.01 minimum at RoboMarkets (Pro) and Eightcap; a $0.10 pip value on a 0.01 position at Pepperstone and a 0.01 pip size at RoboMarkets; gold averaged $4,319 in September 2026 and $5,020 in February 2026. Not in the open: an industry-wide list of how each broker defines that unit on XAUUSD. Data current as of October 2026.
    Risk warningEducational information only, not investment advice. Trading leveraged products carries a high risk of losing money.
  • Pip Value Calculator: EURUSD Pip Was €8.94 on a Euro Account

    Pip Value Calculator: EURUSD Pip Was €8.94 on a Euro Account

    Analysis · 9 Oct 2026 · 9 min read

    A round 10 per pip only shows up when the pair is quoted in the same money your broker holds for you. We converted 14 pairs at the ECB rates of 8 October 2026 for balances held in USD, EUR, GBP and JPY.

    At a glance
    • On standard pairs one pip on 1 standard lot is 10 units of whatever the pair is quoted in, or 1,000 yen on JPY pairs; what that is worth to you depends on the money your balance is held in.
    • With a dollar balance on 8 October 2026: $10 on EURUSD, GBPUSD and AUDUSD, $6.32 on every yen pair, $11.99 on USDCHF and EURCHF, $13.21 on EURGBP.
    • In euros no common pair pays a round €10: EURUSD €8.94, EURCHF €10.72, EURGBP €11.81, any yen pair €5.65.
    • Pairs with the same quote side pay the same: EURJPY, GBPJPY and USDJPY all paid 1,000 yen, which was $6.32 or €5.65.

    On 8 October 2026 one pip on 1 lot of EURGBP was worth €11.81 to a trader funded in euros, and the same move on 1 lot of GBPJPY was worth €5.65, less than half. The number any pip value calculator returns is 10 units of the pair’s quote currency per standard lot (1,000 yen on JPY pairs), converted into the money you hold at the current rate, so only a pair quoted in your own currency pays a round 10. You run a €20,000 account, risk 1% a trade, and the cell in your risk sheet that says “pip = 10” hasn’t changed since the day you opened it.

    That cell says 1 lot with a stop of 20 pips costs exactly €200. On EURUSD the stop actually costs €178.79. On EURGBP it costs €236.13, 18% over budget before the trade has moved. On USDJPY it risks €112.96, and almost half of your 1% sits unused.

    With a dollar balance the anchor is easy: anything that ends in USD pays $10 at any price. So which pair plays that role when you hold euros, the one whose value never moves?

    Hold that question. Only two currencies matter here: the second one in the pair’s name and the one your broker keeps your balance in. Leverage doesn’t enter into it, and the first one in the name matters only when your balance is held in it, as the euro is in EURUSD for a trader funded in euros.

    01Euro accounts

    How much is 1 pip in forex on a euro account?

    Across the 14 majors and crosses in our grid, from €5.65 to €11.81 per standard lot on 8 October 2026, depending on what the pair is quoted in. Each one is 10 dollars, 1,000 yen, 10 francs or 10 pounds, converted at that day’s ECB reference rate, and the full grid is in the table further down.

    It’s like a café menu printed in francs while your card is in euros: the prices on the menu stay the same, but the amount charged to your card changes with the exchange rate. To see by how much, we ran the same conversion on every ECB euro reference rate since January 2010, 4,294 fixings in all:

    2012201620202024€6€8€10€12€14the “10 a pip” habitEURGBP €11.81EURCHF €10.72EURUSD €8.94USDJPY €5.65EURUSD €10.45, 28 Sep 2022(euro under $1)USDJPY €10.5724 Jul 2012EURCHF +17%15 Jan 2015EURGBP €14.36, 5 Aug 2015On a euro account, no line stays putValue of one pip on 1 standard lot, in euros,at every daily ECB reference rate, Jan 2010 to 8 Oct 2026Source: ECB euro reference rates (one fixing a day, about 14:10 CET; no intraday prices).Pip = 10 units of the quote currency (1,000 yen on JPY pairs), converted to EUR.Calculation by VipTools, 9 Oct 2026.

    The blue line is the one most euro traders assume is flat. Since 2010 the EURUSD line, counted in euros, has moved between €6.72 on 4 May 2011 and €10.45 on 28 September 2022. It reached €10 or more on 48 fixings out of 4,294, all of them between 23 August and 10 November 2022, the only weeks since 2010 when the euro fixed at or below a dollar.

    Was the 10 in your sheet ever true for you, or did it come from a dollar example?

    The red line went the other way. On 24 July 2012 one USDJPY pip was worth €10.57; on 17 April 2026 it was €5.33, the lowest figure we found in the ECB series back to 1999. The green line shows that the figure can jump overnight too. On 15 January 2015, the day the Swiss National Bank discontinued its minimum exchange rate, the EURCHF line went from €8.33 to €9.73 between two fixings, 17% in a day.

    02Yen pairs

    USDJPY pip value per lot

    One pip on 1 lot of USDJPY is 1,000 yen, which was £4.78 to a trader funded in pounds on 8 October 2026. EURJPY, GBPJPY and AUDJPY paid exactly the same, because that amount is counted in the second currency, and with a sterling balance the first one in those pairs never enters the sum.

    The quote makes that hard to believe. GBPJPY worked out at 209.04 from ECB rates that day and USDJPY at 158.28, so GBPJPY looks like the bigger pair. It isn’t: both pay 1,000 yen per pip on 1 lot, so the bigger quote doesn’t make the step bigger. What differs is how many pips they travel, and that’s a question for your stop.

    Crosses with no dollar and no euro work the same way. AUDCAD pays 10 Canadian dollars a pip, which was $7.01 or €6.27 on 8 October, so your platform needs a third rate, CAD into whatever you’re funded in. The MQL5 reference from MetaQuotes says these helper cross rates, needed “for calculation of margin requirements or profits in deposit currency”, are selected automatically even when Market Watch doesn’t show them.

    03Cross pairs

    How to calculate pip value for cross pairs

    Take the amount in the pair’s second currency and convert it once, at the rate between that money and your balance:

    Pip value = lots × 100,000 × pip size × (price of 1 unit of the quote side in the money you hold)

    Pip size is 0.0001, or 0.01 on yen pairs. For GBPJPY with a euro balance that’s 1 × 100,000 × 0.01 × (1 ÷ 177.05) = €5.65. OANDA’s help centre spells out the same rule:

    “Home currency conversion fees are applicable when a trade/transaction is in an Instrument with a Quote currency other than your Account’s Home currency.”

    OANDA help centre, “Home currency conversion fees”, checked October 2026

    Here’s the whole grid for 1 standard lot, with a column for each of the four balance currencies. Pairs are grouped by quote side, because inside a group the figure is identical:

    Pairs (quoted in)USDEURGBPJPY
    EURUSD, GBPUSD, AUDUSD (USD)$10.00€8.94£7.57¥1,583
    USDJPY, EURJPY, GBPJPY, AUDJPY (JPY)$6.32€5.65£4.78¥1,000
    USDCHF, EURCHF (CHF)$11.99€10.72£9.08¥1,898
    EURGBP (GBP)$13.21€11.81£10.00¥2,090
    USDCAD, AUDCAD (CAD)$7.01€6.27£5.31¥1,110
    EURAUD, GBPAUD (AUD)$6.94€6.21£5.26¥1,099

    Source: ECB euro reference rates, 8 October 2026; cross rates and conversion by VipTools.

    The answer

    Look down the EUR column: not one row is 10.00. A pair pays a fixed amount to a euro balance only if it’s quoted in euros, and a broker pip calculator we opened on 9 October lists 47 pairs, none of which ends in EUR. The euro almost always comes first in the pair’s name. When you hold euros, there is no anchor.

    The other columns each get theirs: in our grid dollar balances have three pairs fixed at $10, pound balances only EURGBP at £10, and yen balances all four yen pairs at ¥1,000.

    Has a EURGBP stop ever cost you more than the same stop on EURUSD at the same size? In euros on 8 October the two pips were €2.87 apart, and every move on either gets converted at a rate that keeps moving under the trade.

    Three places where the formula still trips people up:

    • The rate is live. Our grid uses ECB fixings, taken once a day at about 14:10 CET. Your platform converts at its own quotes, which move all session.
    • Winners and losers can be priced apart. The MQL5 reference lists two separate tick values per symbol, one for a profitable position and one for a losing position.
    • Stored numbers age. A USDJPY table written for a euro trader in July 2012 overstates today’s figure by almost double: €10.57 against €5.65.
    Worth knowing

    OANDA charges a home currency conversion fee of 1.0% of the mid-market rate on realised profit and loss that has to be converted into your base money, on its v20 and v20 MT4 accounts. At the 8 October ECB rate that turns EURUSD’s €8.94 into about €8.85 on a winner and €9.03 on a loser. Source: OANDA help centre (OANDA Europe Limited), checked October 2026.

    04Calculator setup

    Pip value calculator: which account currency to pick

    The one your broker keeps your balance in, not the one you think in and not USD by default. The calculator then converts the amount from the quote side at the current rate, the step a fixed 10 skips.

    Our position

    Our position: delete the pip column from your risk sheet. Store only what each pair is quoted in and work out the per-pip amount on the day you size the trade. Such a table is a snapshot of exchange rates, and the chart shows how fast those go stale in euros.

    Before the next order:

    1. Open the pip calculator, set it to the currency your balance is held in and choose the pair.
    2. Multiply that figure by your stop in pips. That’s your loss at the stop for 1 lot.
    3. Divide your risk budget by that number to get the size, or let the lot size calculator do it.

    On the €20,000 account with a €200 budget and a stop of 20 pips, step 3 gives 1.11 lots on EURUSD, 1.77 on USDJPY and 0.84 on EURGBP, not 1 lot on all three.

    05Definition

    What is a pip value?

    It’s what a one-pip price move is worth on your position, in the money you hold. A pip is 0.0001 on most pairs and 0.01 on yen pairs, and 1 standard lot is 100,000 units of the first currency, so everything after the first 10 units, or 1,000 yen, is a conversion.

    One thing we couldn’t pin down: OANDA publishes its conversion fee, but for the other brokers we looked at we found no public figure for the rate they use to turn profit on the quote side into your balance. The figure in your terminal can sit a little off our grid, and it’s the one you’re paid on.

    Back to the cell that says 10. On 8 October it was wrong for all three trades on that sheet: the stops would have cost €178.79, €112.96 and €236.13 against the €200 written next to them.

    Check the pip on your pair

    Today’s pip value for any pair and account currency. Free, in your browser, no sign-up.

    Open the pip calculator →
    How we checkedWe opened the ECB euro reference rate history to 8 October 2026, OANDA’s help page on conversion fees, the MQL5 symbol properties reference and the Swiss National Bank’s release of 15 January 2015; we calculated the 1-lot value for 14 pairs in four balance currencies, and the euro-side value of four pairs on every fixing since January 2010; we did not use intraday prices. What is established: on 8 October 2026 a 1-lot pip in euros was €8.94 on EURUSD, €5.65 on yen pairs and €11.81 on EURGBP; OANDA Europe’s conversion fee on v20 accounts is 1.0%. Not in the open: the conversion rate the other brokers we looked at apply to profit and loss. Data current as of October 2026.
    Risk warningEducational information only, not investment advice. Trading leveraged products carries a high risk of losing money.
  • Forex Correlation: Seven 1% Trades Moved Like One 5.8% Bet

    Forex Correlation: Seven 1% Trades Moved Like One 5.8% Bet

    Analysis · 9 Oct 2026 · 8 min read

    We measured a year of daily ECB rates for the seven major dollar pairs. If you hold several of them at 1% each, your account is carrying one large dollar position, and your platform shows it as several small ones.

    At a glance
    • Forex correlation runs from −1 to +1. On daily returns from 9 October 2025 to 8 October 2026, EURUSD scored +0.84 with GBPUSD, −0.84 with USDCHF, +0.70 with AUDUSD and −0.56 with USDJPY.
    • The tightest pairs that year were EURUSD with GBPUSD and EURUSD with USDCHF (both 0.84 in size), then AUDUSD with NZDUSD at +0.81. The loosest was AUDUSD with USDJPY at −0.32.
    • Seven 1% trades against the dollar swung like one trade risking 5.8%. Had the pairs been independent, they would have swung like one 2.65% trade.
    • Correlation moves. Over rolling windows of 90 daily changes, about four months, EURUSD and GBPUSD went from 0.29 (window ending 4 March 2020) to 0.92 (16 July 2026).

    On 98 of the last 255 daily changes in ECB rates, all seven major dollar pairs moved the same way against the dollar; if they were independent, that would happen on about 4. Forex correlation is a number from −1 to +1 that shows how closely the daily returns of two currency pairs move together, and over the 12 months to 8 October 2026 EURUSD scored +0.84 against GBPUSD and −0.84 against USDCHF. You have seven tickets open: long EURUSD, GBPUSD, AUDUSD and NZDUSD, short USDCHF, USDJPY and USDCAD, each sized so its stop costs 1% of a $10,000 account, $100.

    The platform lists them as seven lines with seven small numbers. The market sees one trade: short the dollar. The stops add up to 7%, and the honest figure sits somewhere between that and the comfortable 2.65% you’d get if the pairs were unrelated.

    So how small would each of the seven have to be for the whole basket to risk what one trade used to? Hold that question; the answer needs the table.

    01Most correlated pairs

    Which forex pairs are most correlated?

    Pairs that share a currency, and among the majors that currency is the dollar. We took the European Central Bank’s euro reference rates, worked out the seven dollar pairs from the euro crosses and measured the correlation of daily returns over the last 255 daily changes. Here’s how each pair lined up with EURUSD, signs as the pairs are quoted:

    • GBPUSD: +0.84
    • USDCHF: −0.84
    • NZDUSD: +0.74
    • AUDUSD: +0.70
    • USDCAD: −0.62
    • USDJPY: −0.56

    The minus signs only mean the dollar sits first in the quote. A short USDCHF is a dollar short, just like a long EURUSD, and the two positions moved together with a correlation of 0.84. The yen was the loosest of the group: USDJPY averaged 0.45 with the other six pairs, while EURUSD averaged 0.71.

    One of the guides near the top of the results puts EURUSD and GBPUSD at +0.95 without saying over which period or time frame. Ours is lower, and it comes with both. Did you check the date on the last correlation table you used before opening a second pound or euro trade?

    02Portfolio heat

    Forex correlation table: seven 1% trades, one dollar bet

    The maths fits on one line. Put each trade in units of its own risk, so every 1% position weighs 1, and add up every cell of the correlation matrix, the 1s on the diagonal included:

    Basket swing = √(sum of all cells) × one trade’s risk

    If the pairs were unrelated, every cell off the diagonal would be zero and seven trades would swing like √7 = 2.65 trades. If they were perfectly correlated, the sum would be 49 and the swing 7. Our 49 cells summed to 33.44, so the swing was 5.78. Dividing 49 by 33.44 gives the number of independent bets the seven were worth: 1.47.

    Here are three baskets on a $10,000 account at 1% per trade, measured on the same 12 months:

    BasketStops add up toIf unrelated, swings likeMeasured, swings likeIndependent betsPer trade for a one-trade swing
    EURUSD + GBPUSD$200$141$1921.09$52
    + short USDCHF$300$173$2801.15$36
    All seven against USD$700$265$5781.47$17

    Source: ECB euro reference rates, 9 October 2025 to 8 October 2026; calculation by VipTools. Assumes every stop sits at the same multiple of its pair’s daily volatility.

    The answer

    For all seven to swing like one 1% trade, each needs about 0.17% risk: $17 a trade on $10,000, not the $100 you set.

    Common assumption

    You probably counted your open risk as seven separate 1% decisions; in the year we measured it behaved like one 5.8% decision.

    One guide near the top of the results suggests 0.5% on each of two correlated pairs instead of 1%. On our numbers that works for two: EURUSD plus GBPUSD at half size swings like 0.96 of one trade. It stops working at seven, where half size still swings like 2.9 trades.

    03Rolling stability

    How stable is the EURUSD GBPUSD correlation?

    Not very, and that’s why we wouldn’t wait for a high reading before cutting size. Over rolling windows of 90 daily changes since 2015, EURUSD and GBPUSD went as low as 0.29 in the window ending 4 March 2020 and as high as 0.92 in the one ending 16 July 2026. On 8 October 2026 it stood at 0.88.

    Across all seven pairs the average correlation moved over almost the same range, from 0.27 in the window ending 5 December 2019 to 0.79 in the one ending 3 October 2025. Here’s what that did to the number of bets:

    2016201820202022202420261234567Independent betsWhat the platform shows: 7 separate 1% trades3 separate tradesMost spread out:2.7 bets, Dec 20198 Oct 2026:1.5 bets7 trades against USD (all majors)3 trades: EURUSD, GBPUSD, short USDCHFSeven trades, how many bets?Equal-risk positions against the US dollar, independent betsN²/ΣC, rolling correlation over 90 daily changes (~4 months)Source: ECB euro reference rates (one fixing a day), Jan 2015 to 8 Oct 2026; USD pairsderived from EUR crosses. Calculation by VipTools, 9 Oct 2026. Assumes stops at the samemultiple of each pair’s volatility.

    In those windows since January 2015, seven dollar trades were worth 1.69 independent bets at the median and 2.69 at best, in December 2019. On 82% of days they were worth fewer than two. The three-pair basket of EURUSD, GBPUSD and short USDCHF never reached 1.8.

    Our position

    Our position: count every trade against the same currency as one bet first, size them as one, and only then look at a correlation table to see whether you can afford a little more. Reading the table first invites you to wait for a high number, and that number is built on the last four months.

    Worth knowing

    the dollar was on one side of 89% of all foreign exchange trades in April 2025, according to the BIS Triennial Central Bank Survey published on 30 September 2025. Every major pair has the dollar on one side, so a basket of majors traded against it is a dollar position however many tickets it has.

    04Hedge or not

    EURUSD USDCHF correlation: where the formula misleads

    The formula trusts the past, and a correlation over the last four months can sit at its strongest the day before it breaks. On 14 January 2015 the correlation of EURUSD and USDCHF over the previous 90 daily changes was −0.99, as close to a mirror as two pairs get. The franc was held to the euro by a floor, and the next day the floor was gone:

    “The Swiss National Bank (SNB) is discontinuing the minimum exchange rate of CHF 1.20 per euro.”

    Swiss National Bank, press release, Zurich, 15 January 2015

    Between the two ECB fixings EURUSD fell 0.57% and USDCHF fell 13.91%. A trader holding long EURUSD against long USDCHF as a “hedge” had two legs that the table called opposite. Both lost, and in percentage terms the franc leg lost 24 times as much as the euro leg.

    The other two traps are quieter. The formula assumes each stop sits at the same multiple of its pair’s volatility; a tight stop on one pair and a wide one on another put more weight on one leg than the sum of the cells shows. And our numbers come from one ECB fixing a day, taken around 14:10 CET. They say nothing about how the pairs move against each other in the hour your stops are hit.

    That’s the boundary of what we measured: we couldn’t find a free, dated source of intraday correlation for the majors, so we don’t know whether the 0.84 holds, rises or falls inside the day.

    Before you open the next trade against a currency you already hold:

    1. Add up the pairs that share that currency and count them as one position.
    2. Divide your normal risk by √(sum of the cells), or by the number of trades if you have no fresh matrix. Seven trades: √33.44 = 5.78, so 1% ÷ 5.78 = 0.17% each.
    3. Put the smaller risk and each stop into the lot size calculator and size every leg from it.
    05Correlation basics

    What is correlation in forex?

    It’s the Pearson correlation of two pairs’ returns: how often, and by how much, they move up or down together. It’s measured on returns, not on price levels, because two prices that both drift for a year will look correlated even when their daily moves aren’t. At +1 the pairs move as one, at −1 as mirror images, and at 0 there’s no straight-line link.

    The sign depends on how the pair is quoted. EURUSD and USDCHF show −0.84, but long one and short the other is the same dollar trade twice. VipTools doesn’t have a correlation matrix yet; until it does, the cells above are the ones we’d use for majors.

    Back to the seven tickets. The risk column still shows seven lines of $100, and on the numbers from the past year they swing like one $578 bet against the dollar, while the loss if every stop is hit is still $700.

    Size your next trade

    Account, risk and stop in, position size out. Free, in your browser, no sign-up.
    Open the lot size calculator →
    How we checkedWe opened the ECB euro reference rate history to 8 October 2026, the SNB press release of 15 January 2015 and the BIS Triennial Survey release of 30 September 2025; we worked out seven dollar pairs from the euro crosses and calculated daily-return correlations, basket swing and independent bets in a script we publish with the chart; we didn’t find a free, dated source of intraday correlation. What is established: over 9 October 2025 to 8 October 2026 EURUSD correlated +0.84 with GBPUSD and −0.84 with USDCHF; seven equal-risk trades against the dollar swung like 5.78 trades. Not in the open: how these correlations behave inside the trading day. Data current as of October 2026.
    Risk warningEducational information only, not investment advice. Trading leveraged products carries a high risk of losing money.
  • Drawdown in Trading: 18% on EURUSD Was 54% at 3x Leverage

    Drawdown in Trading: 18% on EURUSD Was 54% at 3x Leverage

    Analysis · 9 Oct 2026 · 8 min read

    We ran one EURUSD long through 16 months of ECB daily rates, with a fixed lot and with a lot resized daily. It concerns anyone planning growth in a compounding calculator.

    At a glance
    • A drawdown of 10%, 20%, 30% and 50% needs a gain of 11.1%, 25.0%, 42.9% and 100% to get back to the old high.
    • At 3% a month, compounded, a −20% drawdown takes 8 months to recover and a −50% one takes 24.
    • From 13 January to 8 June 2010 EURUSD fell 18.0%; the equity of a long worth 3x the starting balance fell 54.0% with a fixed lot and 45.7% with the lot resized daily.
    • MetaTrader 5 reports maximum balance drawdown as the largest fall from a local balance high to the next low, in money and in percent, and gives the same for equity.

    On 21 April 2011 EURUSD was back at 1.4584, above the 1.4563 of 13 January 2010, yet a 3x long that had resized its lot to its equity every day was still 4.1% below its starting equity. Drawdown in trading is the fall of your account from its highest balance or equity to the next low, counted in percent of that high, and the gain you need to get back is always bigger than the loss: −20% takes +25%, −50% takes +100%. You have a compounding calculator open, 3% a month typed in, and the curve climbs in a clean line for 24 months.

    That line has no losing month in it. Real accounts do.

    The same position with a fixed lot was back in profit that April day, at +0.4%. Why would the account that cut its size after losing come back later than the one that never cut it?

    01Recovery maths

    How to recover from drawdown in forex

    With a gain of 1 ÷ (1 − drawdown) − 1, earned on the smaller balance. A $10,000 account that drops to $8,000 has lost $2,000, but $2,000 on $8,000 is 25%. The same $2,000 is 20% of where you were and 25% of where you are.

    Here’s what that does to time. We took four drawdowns and three steady monthly returns, compounded, and counted the months to get back to $10,000:

    Drawdown$10,000 becomesGain neededMonths at 1%Months at 3%Months at 5%
    −10%$9,00011.1%1143
    −20%$8,00025.0%2385
    −30%$7,00042.9%36138
    −50%$5,000100.0%702415

    Months rounded up. Calculation by VipTools.

    Look at the 1% column. A steady 1% a month needs almost six years to climb out of −50%.

    Now put one bad month into a plan. At 3% a month, $10,000 grows to $20,328 in 24 months. Swap one of those months for −20% and the same 24 months end at $15,789. Repairing the −20% takes 8 months at 3%, as in the table; reaching $20,328 takes about eight and a half, because the bad month also didn’t earn its 3%. Have you put that one −20% month into your plan, or only the 3% ones?

    02Compound growth

    Forex compounding: fixed lot or resized lot?

    The answer

    A fixed lot hits harder on the way down; a resized lot slows you on the way back. That’s the answer to the April 2011 question.

    Jan2010Apr2010Jul2010Oct2010Jan2011Apr2011−60%−40%−20%0%+20%+40%8 Jun 2010 lowprice −18.0%same lot −54.0%resized −45.7%21 Apr 2011: price backat 1.4584, same lot +0.4%,resized still −4.1%EURUSD price, no leverage3x, same lot all the way3x, lot resized to balance dailySame EURUSD long, two ways to size itAccount equity from 13 Jan 2010 entry (EURUSD 1.4563), longposition worth 3x the starting balance, daily ECB ratesSource: ECB euro reference rates, 13 Jan 2010 to 31 May 2011, one rate a day(set around 14:10 CET). Model by VipTools, 9 Oct 2026. Spread, commissionand swap not included.

    We started both accounts with $10,000 on 13 January 2010 at 1.4563, long 0.206 lot, which is a position worth 3x the starting balance. One kept 0.206 lot the whole way. The other was resized at each daily ECB rate so the position stayed at 3x whatever the account was worth. That’s what a compounding plan does, on the way up and on the way down. We marked both at each daily rate with the trade still open, so every figure here is an equity drawdown, the version that counts open trades.

    13 January is our entry, not a market peak. EURUSD had topped at 1.5120 on 3 December 2009, and from there to 8 June 2010 the price fell 21.0%.

    By 8 June 2010 EURUSD was at 1.1942, down 18.0%. The fixed-lot account was down 54.0%, $4,601 of equity left, still holding a position worth $24,601. Its real leverage had grown from 3x to 5.3x. The resized account was down 45.7%, and its position was worth 54.3% of what it was at the start.

    Then price came back, 22.1% from the low to 21 April 2011. The fixed lot needed +117.4% on its equity and got +118.3%, because the full-size position took the whole rebound. The resized account needed +84.3% and got less, because it was climbing with about half the position value. It crossed its starting equity only on 28 April 2011, at 1.4794, when price was 1.6% above where it started.

    Common assumption

    You probably assumed that compounding works the same in both directions; after the 2010 drawdown the resized account made +76.8% against the +84.3% it needed, because the gain was made on a smaller base with a smaller lot.

    03Max DD formula

    Maximum drawdown formula

    Maximum drawdown, or max drawdown, is (trough − peak) ÷ peak, taken at the worst peak-to-trough fall in the whole record. MetaTrader 5 prints it in every Strategy Tester report, in money and in percent. Its help page defines the percentage version, Balance Drawdown Relative, as the:

    “difference in percentage terms between the highest local balance value and the next lowest account balance value.”

    MetaQuotes, MetaTrader 5 Help, “Testing Report”, checked October 2026

    The same report has an equity version that counts open trades, and on a leveraged account that’s the one that matters: a margin call doesn’t wait for you to close.

    We ran the formula on the full ECB euro reference rate history, January 1999 to 8 October 2026, for a plain long with no leverage. GBPUSD and USDJPY are crosses we worked out from the ECB euro rates. GBPUSD fell 49.7% from 2.1064 on 8 November 2007 to 1.0596 on 28 September 2022. USDJPY fell 43.8% from 134.81 in February 2002 to 75.77 in October 2011 and only regained that high in June 2022, 20.3 years after the peak.

    Worth knowing

    EURUSD has not regained its 15 July 2008 high of 1.5990 by ECB rates. Its maximum drawdown from that high was −40.2%, to 0.9565 on 28 September 2022, a hole that needed +67.2%. On 8 October 2026 it stood at 1.1186, a current drawdown of −30.0%, so a long opened at the 2008 high still needed +42.9% that day, the −30% row of our table. Source: ECB euro reference rates, full history, October 2026.

    04Compounding traps

    Forex compounding calculator: where it misleads

    A compounding calculator shows what a fixed percentage does over time, and our compounding calculator is the right tool for that sum. The trouble starts when the output is read as a forecast:

    • No red months. The formula multiplies by the same 1 + r every period. One −20% month in 24 costs you $4,539 against the clean line at 3%.
    • The percentage is always on today’s balance. After a loss the same 3% is 3% of less money, which is exactly what slowed our resized account, and the calculator never sees the loss unless you apply it by hand.
    • Leverage isn’t in the formula. An 18% move in price became 54% on a 3x account.
    Our position

    Our position: keep resizing the lot down in a drawdown, even though it slows the way back. On our run the resized account was 4.1% below its starting equity on the day price returned, but at the low it was 8.3 points less deep, and the fixed account was carrying 5.3x leverage on what was left. With the fixed lot, EURUSD at 0.9709, 18.7% under the June low, would have wiped out the $10,000 on paper; in a real account the broker’s stop-out would have closed the trade well before that, with the loss locked in.

    Before you trust a compounding plan:

    1. Run the calculator at your target rate for one month less than your horizon.
    2. Take your worst real month off that result by hand (for −20%, multiply by 0.8), run the calculator again from the new balance and count the months until it reaches the first plan’s end figure.
    3. Size each trade off today’s balance with the lot size calculator, not off the high.
    05Definition

    What is drawdown in trading?

    It’s how far your account has fallen from its last high, in money or in percent, measured on balance (closed trades) or on equity (open trades included). The current drawdown is today’s distance from the high; the maximum drawdown is the worst one in the record.

    Our model has limits. ECB rates are one fixing a day, set around 14:10 CET, so the real 2010 lows could only have been deeper than our curves, and we left out spread, commission and swap. We also found no published figure for how deep retail forex drawdowns usually go or how long they last.

    Back to the calculator with 3% a month typed in. Run it for 23 months, take 20% off the $19,736 by hand, and month 24 ends at $15,789, not $20,328.

    Run your own growth plan

    Starting capital, monthly return, horizon. Free, in your browser, no sign-up.

    Open the compounding calculator →
    How we checkedWe opened the ECB euro reference rate history (1999 to 8 October 2026), the ECB’s page on how the rates are set, and the MetaTrader 5 help page on the Strategy Tester report; we calculated the recovery table and the 2010 to 2011 EURUSD model (3x long, fixed lot against a lot resized daily) ourselves; we did not find public data on typical retail forex drawdowns. What is established: −10%, −20%, −30% and −50% need +11.1%, +25.0%, +42.9% and +100%; on ECB rates EURUSD fell 18.0% from 13 January to 8 June 2010 and was back above its start on 21 April 2011; MetaTrader 5 defines relative balance drawdown from the highest local balance to the next low; our model measures equity. Not in the open: how deep and how long retail forex drawdowns usually are. Data current as of October 2026.
    Risk warningEducational information only, not investment advice. Trading leveraged products carries a high risk of losing money.
  • Forex Spread Cost: EURUSD 1.16% of a Day, Gold at Most 0.87%

    Forex Spread Cost: EURUSD 1.16% of a Day, Gold at Most 0.87%

    Analysis · 9 Oct 2026 · 8 min read

    Published raw-account prices put the full trip in and out of EURUSD at 0.7 to 0.8 pips and gold’s at $0.15 to $0.70. From January to 8 October 2026, the euro took the bigger share of its daily range every day.

    At a glance
    • Round turn in pips = spread + (per-side fee × 2) ÷ pip value of 1 lot in account currency. Tickmill’s typical 0.1-pip EURUSD quote plus a $6 fee is 0.7 pips, or $7 a lot.
    • Gold’s total depends on which published figure you take: 0.09 plus the fee is $15 to $16 per contract, while IC Markets’ specification sheet average of 0.63 makes it $70.
    • On 8 October 2026 the raw EURUSD cost of getting in and out was 1.16% of the pair’s 14-day average daily range; gold’s was 0.19% at 0.09 and 0.87% at 0.63.
    • A no-commission quote of 1.4 pips on the pair, at another broker, costs $14 per position: 2.32% of the same range.

    Getting in and out of EURUSD on a raw account costs $7 a lot and gold $15 to $70, yet on 8 October 2026 the cheaper euro trade took 1.16% of its average day and gold at most 0.87%. Forex spread cost is the gap you cross plus the fee you pay to open and close, expressed in pips: on the euro a 0.1-pip typical bid-ask and a $6 charge for both sides on a $10-a-pip contract come to 0.7. You close a 1-lot EURUSD scalp one pip in your favour, and the history tab shows $10.00 in the Profit column and −6.00 in the Commission column right next to it.

    So the trade made $4. The bid-ask gap has no column; you paid it at the ask.

    Gold charges the same −6.00 and at least twice as much in total. Why would the dearer trade hurt less?

    01Trading cost formula

    How to calculate spread plus commission in pips

    Convert the fee into pips with the pip value of 1 lot in account currency, then add the spread. Brokers quote it “per side”, and you pay it on the way in and again on the way out.

    Round turn in pips = spread + (commission per side × 2) ÷ pip value of 1 lot in account currency

    Tickmill’s raw account charges $3 per lot per side, with a typical EURUSD spread of 0.1: $6 for both legs, or 0.6 pips at $10 a pip, so the total is 0.7 and six-sevenths of it is the fee.

    We measured each published round turn against the instrument’s average daily range, the mean of the last 14 highs minus lows, on 8 October 2026. Gold ranges come from COMEX gold futures (GC=F, via Yahoo Finance) as a proxy for spot XAUUSD.

    Account and instrumentPublished quoteFee, in and outRound turn, 1 lotSame, as priceShare of 14-day range, 8 Oct
    Tickmill Raw, EURUSD0.1 pip typical$6.00$7.000.7 pips1.16%
    IC Markets Raw, EURUSD0.01 (table) or 0.1 (text) average$7.00$7.10 to $8.000.71 to 0.8 pips1.18% to 1.32%
    OANDA US spread-only, EURUSD1.4 pips listednone$14.001.4 pips2.32%
    Tickmill Raw, XAUUSD0.09 typical$6.00$15.00$0.150.19%
    IC Markets Raw, XAUUSD0.09 (web table) or 0.63 (spec sheet) average$7.00$16.00 to $70.00$0.16 to $0.700.20% to 0.87%

    Source: Tickmill raw account, spreads and instrument pages (“typical” spreads name no account type; gold fee inferred from “commissions only apply to CFDs on FX and Precious Metals”); IC Markets Global spreads pages and undated specification sheet; OANDA US pricing page; checked 9 October 2026. Calculation by VipTools.

    Back to gold’s −6.00. Its average day on 8 October was $80.25, 535 times the $0.15 total cost and still 115 times the $0.70 one. The euro’s was 60.4 pips, 86 times its 0.7. Per lot, gold’s day was worth $8,025 against $604.

    Question for you

    Which did you compare them by: the quoted spread, or the full cost against how far each price travels in a day?

    02Gold vs euro

    Is the XAUUSD spread more expensive than EURUSD?

    Per contract, always. Per unit of movement, it depends on the year and on which gold figure you believe. We held published costs fixed and let the market move the denominator:

    Apr2025Jul2025Oct2025Jan2026Apr2026Jul2026Oct20260.0%0.5%1.0%1.5%2.0%2.5%1.16%0.87%EURUSD, raw:0.1 pip + $6 = $7 a lotGold band: 0.09 + $6 = $15 a lot (dashed)to 0.63 + $7 = $70 a lot (solid)Green: EURUSD cheaper than gold at 0.632026: EURUSD dearer thangold on every day, even at 0.63Round turn as a share of the daily range1 lot, spread + commission, divided by the 14-dayaverage high-low range of the instrumentCosts: Tickmill typical spreads (EURUSD 0.1, gold 0.09), $3/side, gold commission inferred;IC Markets spec-sheet average gold spread 0.63 + $7. Checked 9 Oct 2026, held constant.Ranges: EURUSD and COMEX gold futures GC=F as a proxy for spot (Yahoo Finance),Jan 2025 to 8 Oct 2026. Calculation by VipTools.

    At Tickmill’s typical spreads, the euro’s cost of getting in and out took more of its day than gold’s on all 431 trading days since January 2025: from 2.0x to 23.7x, median 8.2x. IC Markets’ web-table figures give 2.2x to 25.4x, median 8.8x.

    At IC’s 0.63 spec-sheet average the picture splits. The pair was cheaper on 167 of 238 trading days in 2025, the last on 7 October 2025, and dearer on all 193 trading days of 2026 up to 8 October: 0.44x to 5.1x, median 1.76x, 1.33x on 8 October. Gold’s median 14-day range doubled from $54.53 in 2025 to $108.99 in 2026; the pair’s fell from 69.5 to 51.3 pips.

    The same 0.7 is cheap at a 136-pip 14-day average range, the pair’s peak in late April 2025, and heavy at a 36-pip one, its low on 9 September 2026.

    Put it on a stop. A 15-pip EURUSD stop and a $20 gold stop were each about a quarter of the day on 8 October. With $1,000 at risk:

    1. EURUSD on Tickmill’s raw account: 6.67 lots, total cost $46.67, which is 4.7% of the risk.
    2. The pair on OANDA US’s no-commission pricing: the same 6.67 lots cost $93.33, or 9.3%.
    3. Gold: 0.50 lot, $7.50 in and out at 0.09, or 0.8%; $35.00 at 0.63, or 3.5%.
    Our position

    Where we stand: compare instruments by round turn per day of range, never by the quoted spread. On that measure the euro was the costlier instrument on every trading day of 2026 up to 8 October, whichever gold figure you take. Rows 1 and 2 are a cross-broker comparison: OANDA US serves US residents and also offers core pricing plus commission, while Tickmill and IC Markets Global don’t take US clients.

    03Hidden fees

    Forex fees: what the spread formula leaves out

    Forex fees on one trade are the spread, the per-side charge on both legs, swap if you hold past rollover and slippage when a stop fills. The formula on Tickmill’s spreads page covers only the first:

    “Use this formula to calculate the cost of opening a trade: Trade Cost = Spread × Trade Size × Pip Value”

    Tickmill, “Spreads and swaps” page, checked 9 October 2026

    It’s correct for what it says. On Tickmill’s own raw account, though, the fee in and out is $6: six times the $1 a 0.1-pip quote costs on 1 lot of EURUSD. Where the short version misleads:

    • Published is not your fill. IC gives averages, Tickmill “typical” spreads, OANDA a listed figure; none says over which hours. OANDA warns spreads widen around opens, closes and major events.
    • Commission is per side. $3 looks like 0.3 pips; you pay it twice.
    • Swaps and slippage. Neither is in any published spread.
    • Account currency. IC charges a EUR account €3.25 per side; at the ECB rate of 1.1186 on 8 October a EURUSD pip on 1 lot was worth €8.94, so the fee alone was 0.73 pips.
    Important

    IC Markets publishes two gold averages that disagree: 0.09 in the metals table on its spreads page, 0.63 in its undated commodity specification sheet. Its EURUSD row shows a raw average of 0.01 while its text says 0.1. At 0.63 the full trip in and out on gold is $70 per contract, not $16. Source: IC Markets Global spreads page and Commodity Specification Sheet, checked 9 October 2026.

    Question for you

    Do you know whether the figure your broker publishes is measured across the whole day or only the liquid hours?

    04Cost calculator

    Forex spread calculator: which numbers to enter

    A calculator that takes only the quote and position size gives the cost of opening. Feed it the round turn:

    1. Take the gap you see at the hour you trade, or the published one.
    2. Double the per-side fee and divide it by the pip value of 1 lot in account currency.
    3. Add the two and multiply by lots and pip value: that’s the trade’s cost in your account currency.
    4. Divide it by the money at risk to the stop, the same budget you size with in the lot size calculator. Over 5% on a euro scalp means the cost is a big piece of the plan.

    The pip calculator gives step 2’s pip value of 1 lot, so the fee converts correctly on JPY or CHF pairs too. On gold, a 100-ounce contract moves $100 per $1.00.

    What we couldn’t find: any broker on our list saying over which hours its published quote is measured, or how much spreads widen at rollover. Each figure in our table is an average, typical or listed figure, not a promise for your next fill.

    05Bid-ask basics

    What is spread in forex?

    It’s the gap between bid and ask: you buy at the higher price and sell at the lower, so a new position starts behind by that amount. EURUSD quotes it in pips (0.0001), gold in dollars and cents.

    On a spread-only account the fee sits inside that gap; on a raw account it arrives as commission. Add it back and 1.4 pips faces 0.7, not 0.1.

    Back in your history tab, the Commission column on a 1-lot euro trade reads −6.00, and on a gold trade it reads −6.00 too. On the euro that line is six-sevenths of a cost that took 1.16% of a day’s move; on gold the whole cost of getting in and out took 0.87% at the dearest published spread.

    Check the pip on your pair

    Today’s pip value for any pair and account currency. Free, in your browser, no sign-up.

    Open the pip calculator →
    How we checkedWe opened Tickmill’s raw account, spreads and instrument pages, IC Markets Global’s spreads, accounts and specification pages, OANDA’s US pricing page, ECB reference rates and daily EURUSD and COMEX gold futures highs and lows since January 2025; we divided each total cost by the instrument’s 14-day average daily range, holding published costs fixed, with the dearest gold figure as the conservative case; we did not find the hours behind any published spread. What is established: Tickmill Raw charges $3 per lot per side with typical spreads of 0.1 on EURUSD and 0.09 on XAUUSD; IC Markets publishes gold averages of both 0.09 and 0.63 with $7 commission in and out; OANDA US lists a 1.4-pip euro price under spread-only pricing. Not in the open: when and over which hours the published spreads are measured. Data current as of October 2026.
    Risk warningEducational information only, not investment advice. Trading leveraged products carries a high risk of losing money.
  • Lot Size Calculator: 0.25 Lot on EURUSD, 0.39 on USDJPY

    Lot Size Calculator: 0.25 Lot on EURUSD, 0.39 on USDJPY

    Analysis · 9 Oct 2026 · 8 min read

    We ran the position size formula on ECB reference rates for every business day since 2010. It matters if you trade yen or pound crosses with the size you use on EURUSD.

    At a glance
    • Size in lots = (balance × risk %) ÷ (stop in pips × pip value of 1 lot). For $10,000, 1% and a stop of 40 pips on EURUSD that is $100 ÷ $400 = 0.25.
    • On 8 October 2026 one pip on 1 lot paid $10 on EURUSD, $6.32 on USDJPY and GBPJPY, $11.99 on USDCHF and $13.21 on EURGBP, by ECB reference rates.
    • Round the answer down to the volume step, which most brokers set at 0.01: 0.3957 becomes 0.39. On a $2,000 account that rounding turns 1% on EURGBP into 0.79%.
    • Since 2010, a 0.25 position sized as if every pair paid $10 a pip, like EURUSD, risked from 0.61% (yen pairs, July 2026) to 1.72% (EURGBP, July 2014) of a $10,000 account on the pairs we charted.

    On 8 October 2026 the same $10,000 account risking 1% behind a stop 40 pips away needed 0.25 lot on EURUSD, 0.39 on USDJPY and 0.18 on EURGBP. A lot size calculator does one sum: the cash you risk (balance × risk %) divided by the stop in pips times the dollar value of one pip on 1 lot, and of those inputs only that last one changes from pair to pair. You have the EURGBP chart open, the stop sits 40 pips above the last swing high, and the volume box on the order ticket still says 0.25 from your last EURUSD trade.

    That 0.25 would lose $132.07 at the stop, which is 1.32% of the account. Not a disaster on one trade. Over a run of ten losers it’s 13% gone where the plan allowed 10%.

    The formula has one more input that no calculator can fill in for you, and in our model of January 2015, closed at the next ECB fixing, it would have turned a planned $98 loss into one fifty times bigger. We’ll name it after the table.

    01Position size formula

    How to calculate lot size in forex

    Work out the dollars you’re prepared to lose, then divide by what one lot loses over your stop. With $10,000 and 1% you risk $100; on EURUSD a stop of 40 pips costs $400 on that lot, so the position is 0.25.

    The only part that needs thought is what one pip is worth in dollars. One lot is 100,000 units of the first currency, and a pip (0.0001, or 0.01 on yen pairs) on 100,000 units is paid in the second currency of the pair, so it’s worth:

    1. Pairs ending in USD (EURUSD, GBPUSD, AUDUSD): 10 dollars, always.
    2. Pairs ending in JPY (USDJPY, GBPJPY, EURJPY): 1,000 yen, which on 8 October, with the dollar at 158.28 yen, was $6.32.
    3. Pairs ending in GBP or CHF (EURGBP, USDCHF): 10 pounds or 10 francs, so $13.21 and $11.99 that day.

    Notice that GBPJPY pays exactly what USDJPY pays. The first currency doesn’t matter here, only the second one does. So the 1% trade becomes $100 ÷ (40 × $6.318) = 0.3957 on any yen pair, and $100 ÷ (40 × $13.207) = 0.1893 on EURGBP.

    Question for you

    Did your last ticket come from the calculator, or from whatever was left in the volume box after the previous trade?

    02Three accounts

    Position size formula: example on three accounts

    The formula gives an exact number; the platform takes steps, and most brokers set them at 0.01. In MetaTrader 5 the step is a symbol setting called SYMBOL_VOLUME_STEP, which the documentation describes as “Minimal volume change step for deal execution”. We rounded every answer down and checked what the rounding does to the real risk, at 1% and a stop of 40 pips, on 8 October 2026 rates. Sizes in the table are in lots:

    Account (1% at risk)EURUSDUSDJPYEURGBP
    $2,000 ($20)0.0500 → 0.05, loses $20.00 (1.00%)0.0791 → 0.07, loses $17.69 (0.88%)0.0379 → 0.03, loses $15.85 (0.79%)
    $10,000 ($100)0.2500 → 0.25, loses $100.00 (1.00%)0.3957 → 0.39, loses $98.56 (0.99%)0.1893 → 0.18, loses $95.09 (0.95%)
    $50,000 ($500)1.2500 → 1.25, loses $500.00 (1.00%)1.9785 → 1.97, loses $497.86 (1.00%)0.9465 → 0.94, loses $496.58 (0.99%)

    Source: ECB euro reference rates, 8 October 2026; USD crosses derived from euro rates; calculation by VipTools.

    On $2,000 the step eats a fifth of your EURGBP risk: you planned 1% and you trade 0.79%. On $50,000 it vanishes. The step is a small account’s problem, a bit like a pharmacy that only sells tablets in strips of ten.

    Now the input from the top. It’s the stop itself. The formula assumes the market will trade at your stop price, and on 15 January 2015 EURCHF didn’t. The ECB fixing was 1.2010 on 14 January and 1.0280 the next day, 1,730 pips apart. Sized by the book on the 14th, the trade was 0.25 lot with a planned loss of $98.04. Closed at the next fixing it would have lost $4,926, which is 49.3% of the $10,000 account.

    03Risk by pair

    Forex risk calculator: same lot, different risk by pair

    Because the pound is worth more than the dollar, a 10-pound pip costs more than a 10-dollar one, and the gap moves every day with GBPUSD. The same holds in reverse for yen pairs. We took the EURUSD answer, 0.25, and checked what it would have risked on other pairs on every ECB business day since January 2010:

    201020142018202220260.4%0.6%0.8%1.0%1.2%1.4%1.6%1.8%2.0%EURGBPUSDCHFUSDJPY,GBPJPYEURUSD1.72%15 Jul 20141.32%28 Oct 20110.61%28 Jul 2026SNB drops franccap, 15 Jan 2015Same 0.25 lot, different riskLoss at a 40-pip stop as % of a $10,000 account, when thelot is sized as if every pip paid $10 (the EURUSD answer)Source: ECB euro reference rates, daily, 4 Jan 2010 to 8 Oct 2026; USD crosses derivedfrom euro rates. GBPJPY and EURJPY pay the same per pip as USDJPY. Calculation byVipTools, 9 Oct 2026. Spread, commission and slippage not included.

    EURUSD sits on the dashed line at exactly 1%, because the dollar pays its own pip. The rest drift. On 15 July 2014 the same 0.25 on EURGBP risked 1.72%; the correct size that day was 0.14. Yen pairs crossed the 1% line both ways: 1.32% on 28 October 2011, when the dollar bought 75.77 yen, and 0.61% on 28 July 2026, when the rate derived from ECB figures reached 163.91, the highest in that series since 1999. That day the correct yen size was 0.40, not 0.25.

    Common assumption

    You probably keep one dollar figure per pair in your head; on yen pairs it has more than halved since 2011, from $13.20 to $6.32.

    These are reference rates set around 14:10 Frankfurt time once a day, not the highs and lows your broker quoted. The ECB itself says they are published for information purposes only. For sizing that’s fine, because that value moves slowly. For gaps it’s not, and that’s the next section.

    04Gaps & slippage

    Can you lose more than your stop loss?

    Yes. A stop-loss is an order that becomes a market order once price touches it, and if the next available price is far away, you’re filled there. On a quiet day the fill lands near your stop price. On 15 January 2015, by our model on the next ECB fixing, that price would have been half the account away.

    “The Swiss National Bank (SNB) is discontinuing the minimum exchange rate of CHF 1.20 per euro.”

    Swiss National Bank, press release, Zurich, 15 January 2015

    In the three years before that morning the ECB fixing never went below 1.2008, so a stop 40 pips under the cap looked well protected. The 14.4% move between two fixings is what the formula can’t see: it multiplies by the stop distance you type, not by the distance the market jumps. The pip value of the franc also rose 16% in a day, from $9.80 to $11.39 per lot, so even the second input of the formula changed overnight.

    Worth knowing

    MetaTrader 5 stores separate tick values for a winning and a losing position, SYMBOL_TRADE_TICK_VALUE_PROFIT and SYMBOL_TRADE_TICK_VALUE_LOSS, the second described as “Calculated tick price for a losing position”. Your platform can price a losing pip slightly differently from a winning one on crosses. Source: MQL5 documentation, symbol properties, checked October 2026.

    We couldn’t find what fills retail clients actually received on EURCHF that morning; no public record collects them, and our model only knows the next ECB fixing. A real fill could have been better or worse than $4,926.

    05Calculator inputs

    Lot size calculator: what to enter before you trade

    Our position

    Four numbers: balance, risk %, stop in pips and the pair. The calculator looks up the pip value at today’s rate, which is the step people skip when they size by memory. Our position is simple. Round down every time, even when 0.3957 is a hair from 0.40, and size every cross fresh from today’s pip value rather than from a table you wrote down last year.

    Before the ticket goes in:

    • Put balance, risk and stop into the lot size calculator, with the pair you’re actually trading.
    • If the pair doesn’t end in USD, check the pip in dollars in the pip calculator; it’s the only input that moves.
    • Take the answer down to the next 0.01, never up.
    • If the pair sits on a currency peg or a central bank can move it inside the trade, announced or not, size as if the stop could be skipped, or stay out.
    06Position sizing basics

    What is position sizing in trading?

    It’s choosing how big a trade is from the loss you accept, not from the margin you have. Leverage decides how much margin the broker holds; position size decides what one pip against you costs. The equation ties three things together: account and risk on top, stop and pip value below, and the lot falls out of the division.

    So back to the EURGBP ticket. The volume box should read 0.18, not 0.25, and at the stop that’s $95.09 instead of $132.07.

    Size your next trade

    Account, risk and stop in, position size out. Free, in your browser, no sign-up.
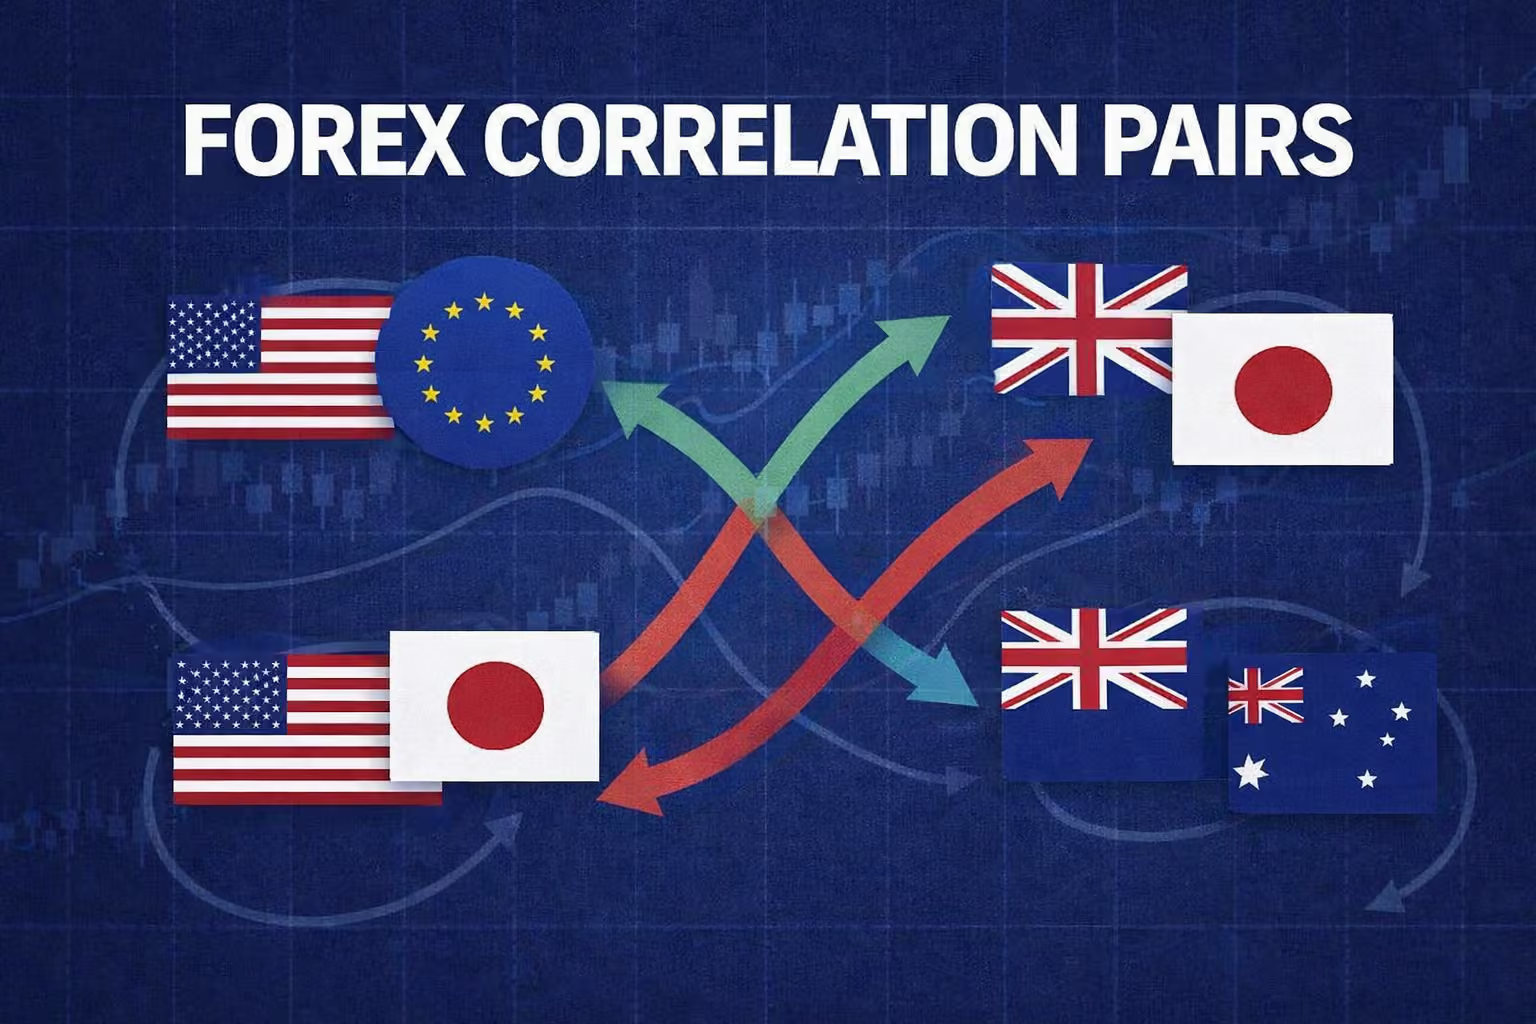
    Open the lot size calculator →
    How we checkedWe opened the full ECB euro reference rate history to 8 October 2026 and the ECB’s page on how the rates are set, the Swiss National Bank’s press release of 15 January 2015 and MetaQuotes’ MQL5 documentation on symbol properties; we calculated pip values for a USD account, sizes rounded down to 0.01 and the risk of a fixed 0.25 lot on every business day since January 2010 ourselves; we did not find a public record of the prices retail stops were filled at on 15 January 2015. What is established: lot size = (balance × risk %) ÷ (stop in pips × pip value of 1 lot); on 8 October 2026 a 1% trade on $10,000 with a 40-pip stop was 0.25 lot on EURUSD, 0.39 on USDJPY and 0.18 on EURGBP; EURCHF fixings moved from 1.2010 to 1.0280 between 14 and 15 January 2015. Not in the open: actual retail fill prices on EURCHF on 15 January 2015. Data current as of October 2026.
    Risk warningEducational information only, not investment advice. Trading leveraged products carries a high risk of losing money.
  • Trailing Drawdown: FTMO 1-Step Failed While $380 in Profit

    Trailing Drawdown: FTMO 1-Step Failed While $380 in Profit

    Analysis · 9 Oct 2026 · 7 min read

    Same $50,000, same 10%, same trades. We ran FTMO’s 1-Step and 2-Step rules, plus Topstep’s 50K limit, over three months of real EURUSD moves; of the two FTMO accounts, the one that failed was the one in profit.

    At a glance
    • FTMO’s 1-Step Maximum Loss trails: it is recalculated at 00:00 CE(S)T, 10% under the highest end-of-day balance or the initial capital, whichever is higher, and can only go up.
    • FTMO’s 2-Step Maximum Loss is static: 10% of initial capital, so a $50,000 account fails when equity drops below $45,000.
    • Topstep’s 50K Maximum Loss Limit is $2,000, trails the end-of-day balance and locks once it reaches the starting level. Topstep itself is futures-only.
    • On our EURUSD run the trailing account failed on 23 September at +$380; on 8 October the static one was still open at −$4,120.

    A 2-lot EURUSD long on a $50,000 FTMO 1-Step account from 23 June 2026 would have failed on 23 September at $50,380, still $380 in profit. Trailing drawdown is a maximum loss limit that moves up with your highest end-of-day balance and never moves down: on FTMO’s version it sits 10% under that high, and on Topstep’s 50K it sits $2,000 under it until it locks at the starting balance. You open the dashboard and see an account still above its start next to a failed Maximum Loss objective.

    The same trades on FTMO’s other account, with the same 10% but a static line, were still running 15 days later, $4,120 down. Which of the two rules did more for the trader?

    01Prop firm rules

    Trailing drawdown vs static: which one ends the account first?

    The trailing one, when both start at the same distance and the account makes money before it gives some back. A static line stays where it was on day one; a trailing line follows your best close.

    We took the ECB euro reference rate for every business day from 23 June to 8 October 2026. The model trader is long 2 lots of EURUSD, which is $20 a pip, and closes and reopens at each daily rate, so every day’s result is realised. Then we laid three rules over the same series of closes and also checked FTMO’s daily loss limits, 3% on the 1-Step and 5% on the 2-Step:

    JulAugSepOct−$7,500−$5,000−$2,500$0+$2,500+$5,000+$7,500+$10,000Topstep rule: floorreached 28 Jul at −$500FTMO 1-Step fails23 Sep at +$380FTMO 2-Step still open8 Oct at −$4,120Best close +$6,14021 AugBalance vs $50,000 startFTMO 1-Step: trailing 10%FTMO 2-Step: static 10%Topstep 50K rule: $2,000, locks at startSame trades, three loss limits$50,000 account, 2 lots long EURUSD from 23 Jun 2026,closed and reopened at each daily ECB reference rateSource: ECB euro reference rates, 23 Jun – 8 Oct 2026. Rules: FTMO x OANDA 1-Step and 2-Step(maximum and daily loss), Topstep 50K Maximum Loss Limit (Topstep itself is futures-only).Model by VipTools, 9 Oct 2026. Spread, commission and swap not included.

    The best close came on 21 August, at +$6,140. On the trailing account it moved the floor to $51,140, which is $1,140 above the starting capital. From there the market took the position down for a month, and on 23 September the account ended the day at $50,380, under the floor while still in profit. The worst single day before that was −$1,120 on 17 September, inside the $1,500 daily limit, so it was the trail that ended the account.

    On the static account nothing moved. The floor stayed at $45,000 through the whole slide. The lowest close was $45,700 on 7 October, and on 8 October the account was still open.

    Question for you

    Have you checked where your floor sits after your best day, or only how much you’re up?

    02EOD trail

    What is EOD trailing drawdown?

    It’s a trailing limit that is reset only at the daily close, so a profit you’re holding at 3 p.m. doesn’t move it. FTMO’s 1-Step and Topstep’s Maximum Loss Limit both work this way. Topstep’s help centre describes the rule in one line:

    “It rises as your end-of-day balance grows, but never moves down.”

    Topstep Help Center, “What is the Maximum Loss Limit?”, checked October 2026

    The floor is set at the close, but the breach is checked on equity during the day. FTMO measures that limit against equity, which it defines as balance plus open P/L, plus or minus swaps, minus commissions. A trade can close green and still break the line at its low before the close.

    Our model uses one ECB rate a day, taken at 14:15 Frankfurt time, so it can’t see those intraday lows. A real account on the same path would have failed on the dates in the chart or earlier, never later. The same goes for intraday trailing rules, where the floor also follows open profit: they move up faster than an end-of-day trail, never slower.

    03Drawdown room

    How much room is left after a winning run?

    Take your highest end-of-day balance, or the starting one if that’s higher, and subtract the trailing amount. If your firm locks the trail at the starting balance, cap it there. Your room is today’s balance minus that number.

    Here’s what the three rules left on our run at two points where the account had come back from a high:

    RuleRoom at start28 Jul: after +$1,500 close, down to $49,50023 Sep: after +$6,140 close, down to $50,380
    Topstep 50K rule: $2,000 trail, locks at start$2,000none, floor reachedfailed earlier
    FTMO 1-Step: 10% trail$5,000$3,000none, $760 under the floor
    FTMO 2-Step: 10% static$5,000$4,500$5,380

    Source: Topstep Help Center; FTMO x OANDA trading objectives; ECB reference rates; calculation by VipTools.

    Common assumption

    You probably counted your room from the $50,000 you started with; on FTMO’s trailing account on 23 September it had to be counted from $56,140.

    The answer

    The trailing rule stopped the account $5,760 below its best close. The static rule let it fall $10,440 from that close, to $45,700 on 7 October, and kept it open. One ended the challenge with $380 of profit still on the account; the other kept the challenge alive and let the trader lose all of the profit and $4,300 of the starting capital.

    04Trading style

    Does a trailing limit punish day traders or swing traders?

    On an end-of-day trail, the trader who closes every day. Our model trader banks each session, so every new high close lifts the floor with it. On FTMO’s 1-Step the trail follows the balance, not open profit, so a swing trader holding the same move unrealised leaves the floor where it was until the position is closed. The breach is still checked on equity, so a position that’s underwater still counts against the line either way.

    Our position

    Our position: if your style regularly gives back half of a run before the next high, take the static product and manage the give-back with your own exits. On the trailing product every new high close raises the line you must stay above, and after a strong run the room is still only 10%, measured from the top.

    The steps are uneven on real prices. Between 23 June and 21 August the closes moved FTMO’s floor up by $6,140, and more than two-thirds of that, $4,280, came in the last three weeks of the run.

    Important

    FTMO’s trail has no lock. FTMO’s text says the limit can only increase, and it is based on the highest end-of-day balance or the initial capital, whichever is higher. Topstep’s lock does not exist there. Source: FTMO x OANDA trading objectives page, October 2026.

    Before you size the next trade on a trailing account:

    1. Write down today’s floor, not the starting one.
    2. Put the gap between balance and floor into the lot size calculator as your risk budget and split it over the trades you plan.
    3. If one stop would use more than half that gap, cut the size or skip the trade.
    05Prop firm basics

    What is trailing drawdown in a prop firm?

    It’s the firm’s drawdown rule written so that the limit follows your best result instead of staying where it started. FTMO uses a 10% end-of-day trail on the 1-Step and a static 10% on the 2-Step; Topstep uses $2,000 on its 50K Combine and stops trailing at the starting balance.

    We couldn’t measure the most common question in this topic: how many accounts each rule ends. Neither firm publishes it.

    On the chart the red line stops at $51,140 on 23 September, the day the account closed $760 under it, at $50,380.

    Size your next trade

    Account, risk and stop in, position size out. Free, in your browser, no sign-up.
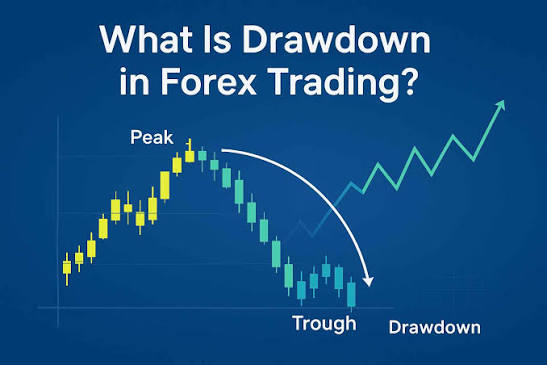
    Open the lot size calculator →
    How we checkedWe opened Topstep’s Help Center articles on the Maximum Loss Limit and on tradable products, FTMO’s trading objectives on its site run with OANDA, and the full ECB euro reference rate history to 8 October 2026; we modelled a 2-lot long EURUSD position closed and reopened at each daily rate and applied FTMO’s maximum and daily loss rules and Topstep’s Maximum Loss Limit as written; we did not use intraday prices. What is established: FTMO 1-Step Maximum Loss, 10% end-of-day trailing, daily loss 3%; FTMO 2-Step Maximum Loss, 10% static, daily loss 5%; Topstep 50K Maximum Loss Limit, $2,000, end-of-day trailing, locks at the starting balance. Not in the open: how often each rule ends accounts. Data current as of October 2026.
    Risk warningEducational information only, not investment advice. Prop firm rules change; check the current rules on your firm’s own site. Trading leveraged products carries a high risk of losing money.
  • Lot Size: 0.01 Lot Pays $0.063 a Pip on USDJPY, Not $0.10

    Lot Size: 0.01 Lot Pays $0.063 a Pip on USDJPY, Not $0.10

    Analysis · 9 Oct 2026 · 8 min read

    At most MetaTrader brokers, OANDA and Pepperstone included, the smallest order is 0.01. On a balance of a few hundred dollars that minimum decides what a stop 20 pips away costs you, and your 1% rule has to fit around it.

    At a glance
    • A standard lot is 100,000 units of the first currency in the pair; 0.1 is 10,000 and 0.01 is 1,000.
    • On 8 October 2026 a one-pip move on the minimum order was worth $0.10 on EURUSD, $0.063 on USDJPY, $0.120 on USDCHF and $0.132 on EURGBP.
    • To keep that minimum inside 1% with a stop of 20 pips you needed $200 on EURUSD, but $264 on EURGBP.
    • OANDA’s own platform takes orders from 1 unit; its MT4 and MT5 accounts, like Pepperstone’s, start at 0.01.

    A $100 account risking 1% on a 20-pip EURUSD stop needs a position of 0.005 lot, and at most MetaTrader brokers the smallest order is 0.01, so the real risk is 2%. Lot size in forex is the number of currency units in your trade: a standard lot is 100,000 units, 0.1 is 10,000 and 0.01 is 1,000, which pays $0.10 per pip on EURUSD. You have the chart open, the stop-loss already sits under the last low, and the calculator says 0.005. The volume box says 0.01 and won’t take less.

    So you click anyway. One stopped trade costs $2 instead of $1, and it doesn’t feel like much. Then you lose five in a row, and the account is down about 10%, not 5%.

    The same order and the same 20 pips cost $1.26 on USDJPY and $2.64 on EURGBP. Why would a euro-pound trade need more than twice the account of a dollar-yen trade, when the size is identical?

    01Micro lot value

    How much is 0.01 lot in dollars?

    On any pair where the dollar is the second currency (EURUSD, GBPUSD, AUDUSD), the minimum order pays $0.10 a pip at any price. On the other pairs it depends on the exchange rate.

    We took the European Central Bank euro reference rates for 8 October 2026, worked out the dollar crosses from them and converted one pip into dollars for each size on a USD account:

    Pair0.01 (1,000 units)1.00 (100,000 units)Loss at 20 pips on 0.01
    EURUSD$0.100$10.00$2.00
    USDJPY$0.063$6.32$1.26
    USDCHF$0.120$11.99$2.40
    EURGBP$0.132$13.21$2.64

    Source: ECB euro reference rates, 8 October 2026; calculation by VipTools.

    Look at the USDJPY row. One broker guide we read still gives $0.10 for USDJPY at this size, and on 8 October the real figure was 37% lower. On a $100 account and 20 pips that’s the difference between thinking you risk 2% and actually risking 1.26%. The mistake runs the other way on EURGBP, where you risk more than the old $0.10 suggests.

    You can check any pair at today’s price in our pip calculator before you trade it.

    02Rounding rule

    What happens when the formula says less than 0.01 lot?

    You can’t place it. The platform won’t accept a volume below the broker’s minimum, so you either trade 0.01 and take the bigger risk or you don’t trade. The formula itself is short:

    Lots = (account × risk %) ÷ (stop in pips × pip value per standard lot)

    Here it is on three small accounts, all at 1% risk and a stop of 20 pips. Where the answer falls between two steps of 0.01, we round down; where it’s under 0.01, the only order left is 0.01:

    AccountPairFormula saysYou tradeLoss at stopReal risk
    $100EURUSD0.00500.01$2.002.0%
    $100USDJPY0.00790.01$1.261.3%
    $100EURGBP0.00380.01$2.642.6%
    $250EURUSD0.01250.01$2.000.8%
    $250EURGBP0.00950.01$2.641.1%
    $500USDJPY0.03960.03$3.790.8%

    Look at the $250 rows. On EURUSD the step leaves you under your 1%, on EURGBP it pushes you over, with the same balance and the same rule. It’s like a shop that sells eggs only by the dozen: if you need four, you buy twelve or go home with none.

    The answer

    On 1,000 units each pip is worth 1,000 times the price step, but it’s paid in the second currency of the pair. On EURGBP that’s 0.1 pound, and on 8 October a pound cost $1.32. On USDJPY it’s 10 yen, and with 158 yen to the dollar that’s six cents.

    Common assumption

    You probably assumed every pair pays a dime a pip at this size; on EURGBP that day it paid $0.132.

    Where does the formula trip up on a small account?

    • The step. Lots move in steps of 0.01, so the formula can’t hit 1% when the answer falls between two of them, and below 0.01 it can only go up.
    • The conversion. The dollar value of a pip changes with the pair and with the exchange rate, so last year’s table gives wrong numbers this year.
    • The spread. The gap between the buy and sell price is paid on top of your stop. A 1-pip spread adds 5% to a stop of 20 pips.
    03Minimum balance

    How much money do you need to trade 0.01 lot?

    For 1% on 20 pips you need $200 on EURUSD, and on other pairs the figure moves with the exchange rate. We ran the same sum on monthly averages of ECB rates since January 2010:

    2012201620202024$100$150$200$250$300$350Smallest account, USDUSDJPY$126EURGBP$264USDCHF$240EURUSD$200Oct 2011: USDJPY 75.8floor $264Jul 2026: USDJPY 163.9floor $122Smallest account where 0.01 lotstays within 1% on a 20-pip stopSame lot, same stop: the floor depends on the pairand moves with the exchange rateSource: ECB euro reference rates, monthly averages Jan 2010 – Oct 2026;right-hand values for 8 Oct 2026.Calculation: VipTools, 9 Oct 2026. USD account, spread not included.

    The dashed line is EURUSD, flat at $200, because the dollar pays its own pip. The others wander. On 28 October 2011, with the dollar at 75.77 yen by ECB rates, a dollar-yen trade needed $264 of balance. On 28 July 2026 the dollar-yen rate worked out from ECB figures reached 163.91, the highest in that series back to 1999, and the same order needed only $122. These are daily reference rates taken at 14:15 Frankfurt time, not the high of the day on the market, so your broker’s quotes that day could have gone further.

    Question for you

    Have you checked whether your last stop came from the chart, or from what the minimum order could afford?

    Because that’s the trap. When the minimum size is too big, it’s tempting to pull the stop closer until the loss fits 1%. On $100 and EURUSD, a stop at 10 pips gives you $1 before the spread. The sum works. The trade changes: the stop sat under the last low for a reason, and at 10 pips it no longer sits there.

    Our position

    We think the answer is simple. If 0.01 breaks your risk limit, skip the trade, or take the same idea on a pair where the pip is cheaper. Don’t shrink the stop to fit the order size.

    “I mean I always trade micro lot 0.01 0.02 sizes never more than 0.1 for me”

    ScottHughes, Babypips forum, 9 January 2020

    That’s a sensible habit, and the guides at the top of the search results say the same: start with micro lots. We’d add the line they leave out. On a $100 account, 0.01 on EURUSD is 2% at 20 pips and 4% at 40.

    04Units & nano lots

    Can you trade less than 0.01 lot?

    Yes, but usually not in MetaTrader. OANDA’s help pages list the minimum on its own platform as 1 unit (0.00001 in MetaTrader terms), while its MT4 and MT5 accounts start at 0.01. Pepperstone lists 0.01 as the minimum on all its accounts.

    Worth knowing

    OANDA’s own platform trades in units, not lots. You type the number of units, so a $100 account can open 500 units of EURUSD and lose $1 at 20 pips before the spread. Source: OANDA help centre, minimum trade size and micro lots pages, checked October 2026.

    Some brokers also offer “nano” lots of 100 units or cent accounts, where the balance is counted in cents. We did not go through every broker’s specification sheet, so before you open one, find two lines in its contract specs: the minimum volume and the volume step. On a small balance those two numbers decide whether 1% is possible at all.

    Before you place the order:

    1. Put balance, risk and stop into the lot size calculator.
    2. If the answer is under 0.01, look at what one pip on that pair costs in dollars, not at the size.
    3. If no pair fits, write the idea down and wait for a bigger balance or a smaller step.
    05Lot types

    What is lot size in forex: standard, mini and micro

    A lot is a packet of the first currency in the pair. On EURUSD a standard one means 100,000 euros, and each pip is worth $10. A mini (0.1) earns a tenth of that and a micro (0.01) a hundredth, $0.10, again only on pairs that end in USD.

    MetaTrader shows the size as a decimal, so you’ll type 1, 0.1, 0.03 or 0.01, never the word “mini”. Leverage only changes how much of your money the broker holds aside as margin while the trade is open. It doesn’t change what each move of that packet is worth.

    So back to the volume box. It shows 0.01, and on a $100 account and a stop of 20 pips that’s $2 on EURUSD and $2.64 on EURGBP.

    Size your next trade

    Account, risk and stop in, position size out. Free, in your browser, no sign-up.
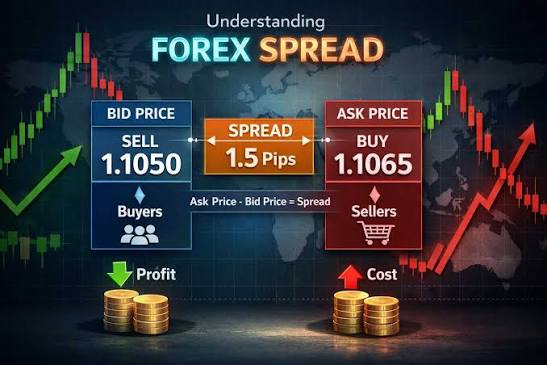
    Open the lot size calculator →
    How we checkedWe opened the ECB euro reference rates (full history to 8 October 2026), OANDA’s help pages on minimum trade size and micro lots, and Pepperstone’s account page; we calculated pip values and minimum balances for a USD account ourselves; we did not find a public list of minimum order sizes across all brokers. What is established: a standard lot = 100,000 units; OANDA’s platform starts at 1 unit and MT4/MT5 at 0.01; USDJPY worked out from ECB reference rates reached 163.91 on 28 July 2026. Not in the open: an industry-wide table of minimum volume and volume step. Data current as of October 2026.
    Risk warningEducational information only, not investment advice. Trading leveraged products carries a high risk of losing money, and most retail accounts lose money.