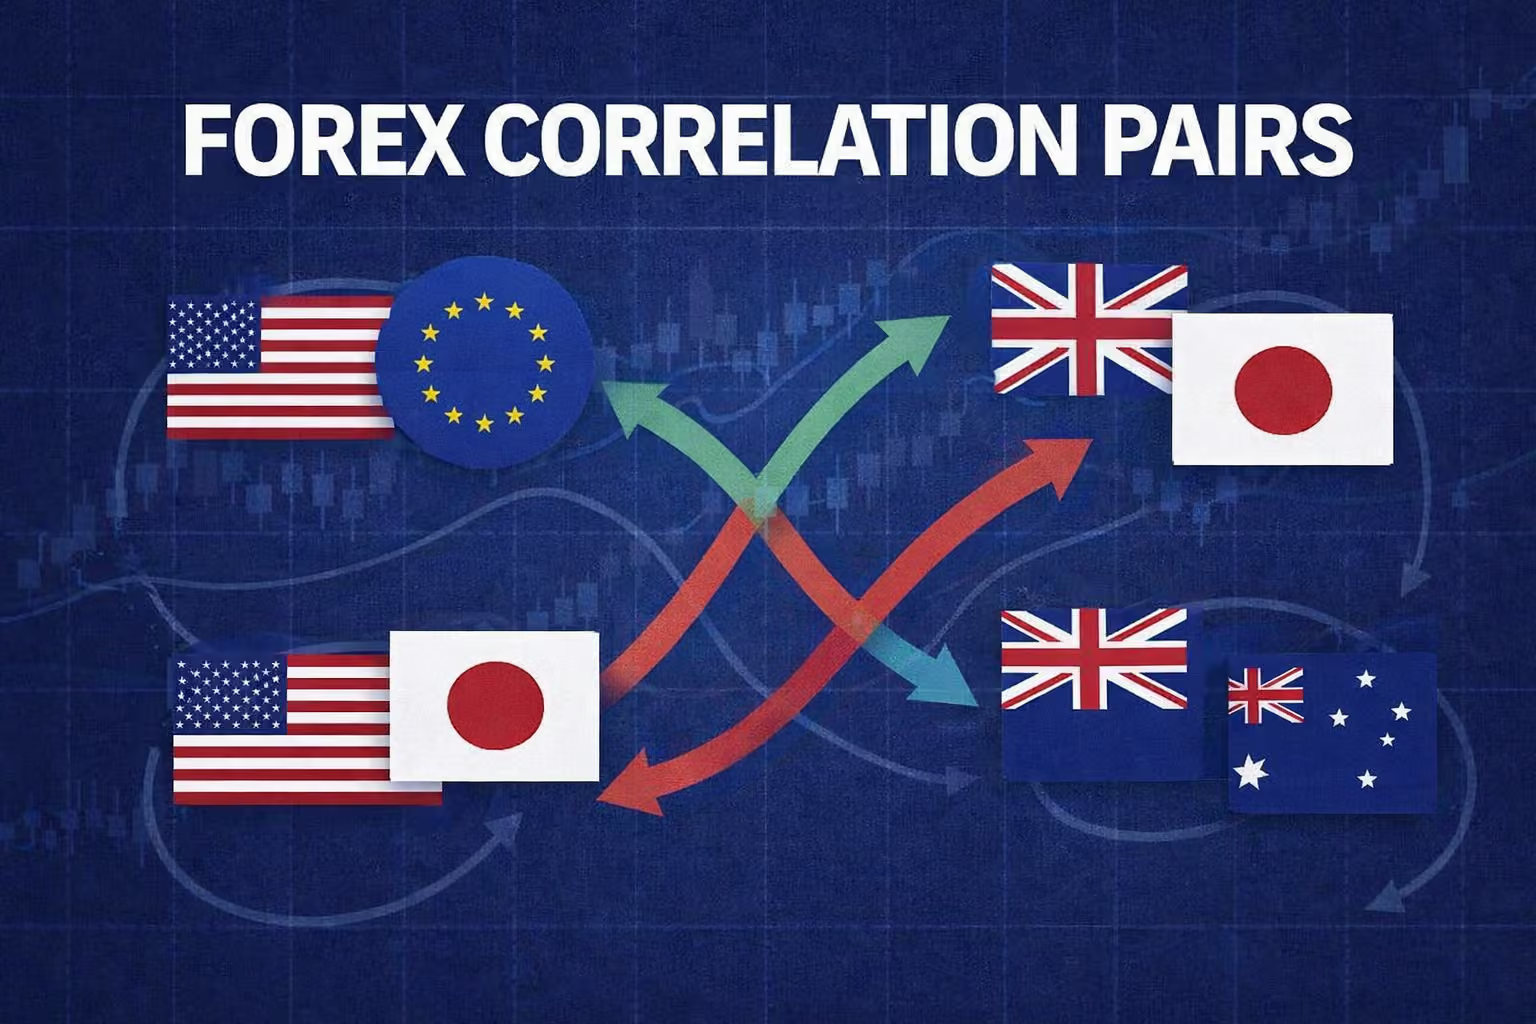
We measured a year of daily ECB rates for the seven major dollar pairs. If you hold several of them at 1% each, your account is carrying one large dollar position, and your platform shows it as several small ones.
- Forex correlation runs from −1 to +1. On daily returns from 9 October 2025 to 8 October 2026, EURUSD scored +0.84 with GBPUSD, −0.84 with USDCHF, +0.70 with AUDUSD and −0.56 with USDJPY.
- The tightest pairs that year were EURUSD with GBPUSD and EURUSD with USDCHF (both 0.84 in size), then AUDUSD with NZDUSD at +0.81. The loosest was AUDUSD with USDJPY at −0.32.
- Seven 1% trades against the dollar swung like one trade risking 5.8%. Had the pairs been independent, they would have swung like one 2.65% trade.
- Correlation moves. Over rolling windows of 90 daily changes, about four months, EURUSD and GBPUSD went from 0.29 (window ending 4 March 2020) to 0.92 (16 July 2026).
On 98 of the last 255 daily changes in ECB rates, all seven major dollar pairs moved the same way against the dollar; if they were independent, that would happen on about 4. Forex correlation is a number from −1 to +1 that shows how closely the daily returns of two currency pairs move together, and over the 12 months to 8 October 2026 EURUSD scored +0.84 against GBPUSD and −0.84 against USDCHF. You have seven tickets open: long EURUSD, GBPUSD, AUDUSD and NZDUSD, short USDCHF, USDJPY and USDCAD, each sized so its stop costs 1% of a $10,000 account, $100.
The platform lists them as seven lines with seven small numbers. The market sees one trade: short the dollar. The stops add up to 7%, and the honest figure sits somewhere between that and the comfortable 2.65% you’d get if the pairs were unrelated.
So how small would each of the seven have to be for the whole basket to risk what one trade used to? Hold that question; the answer needs the table.
Which forex pairs are most correlated?
Pairs that share a currency, and among the majors that currency is the dollar. We took the European Central Bank’s euro reference rates, worked out the seven dollar pairs from the euro crosses and measured the correlation of daily returns over the last 255 daily changes. Here’s how each pair lined up with EURUSD, signs as the pairs are quoted:
- GBPUSD: +0.84
- USDCHF: −0.84
- NZDUSD: +0.74
- AUDUSD: +0.70
- USDCAD: −0.62
- USDJPY: −0.56
The minus signs only mean the dollar sits first in the quote. A short USDCHF is a dollar short, just like a long EURUSD, and the two positions moved together with a correlation of 0.84. The yen was the loosest of the group: USDJPY averaged 0.45 with the other six pairs, while EURUSD averaged 0.71.
One of the guides near the top of the results puts EURUSD and GBPUSD at +0.95 without saying over which period or time frame. Ours is lower, and it comes with both. Did you check the date on the last correlation table you used before opening a second pound or euro trade?
Forex correlation table: seven 1% trades, one dollar bet
The maths fits on one line. Put each trade in units of its own risk, so every 1% position weighs 1, and add up every cell of the correlation matrix, the 1s on the diagonal included:
If the pairs were unrelated, every cell off the diagonal would be zero and seven trades would swing like √7 = 2.65 trades. If they were perfectly correlated, the sum would be 49 and the swing 7. Our 49 cells summed to 33.44, so the swing was 5.78. Dividing 49 by 33.44 gives the number of independent bets the seven were worth: 1.47.
Here are three baskets on a $10,000 account at 1% per trade, measured on the same 12 months:
| Basket | Stops add up to | If unrelated, swings like | Measured, swings like | Independent bets | Per trade for a one-trade swing |
|---|---|---|---|---|---|
| EURUSD + GBPUSD | $200 | $141 | $192 | 1.09 | $52 |
| + short USDCHF | $300 | $173 | $280 | 1.15 | $36 |
| All seven against USD | $700 | $265 | $578 | 1.47 | $17 |
Source: ECB euro reference rates, 9 October 2025 to 8 October 2026; calculation by VipTools. Assumes every stop sits at the same multiple of its pair’s daily volatility.
For all seven to swing like one 1% trade, each needs about 0.17% risk: $17 a trade on $10,000, not the $100 you set.
You probably counted your open risk as seven separate 1% decisions; in the year we measured it behaved like one 5.8% decision.
One guide near the top of the results suggests 0.5% on each of two correlated pairs instead of 1%. On our numbers that works for two: EURUSD plus GBPUSD at half size swings like 0.96 of one trade. It stops working at seven, where half size still swings like 2.9 trades.
How stable is the EURUSD GBPUSD correlation?
Not very, and that’s why we wouldn’t wait for a high reading before cutting size. Over rolling windows of 90 daily changes since 2015, EURUSD and GBPUSD went as low as 0.29 in the window ending 4 March 2020 and as high as 0.92 in the one ending 16 July 2026. On 8 October 2026 it stood at 0.88.
Across all seven pairs the average correlation moved over almost the same range, from 0.27 in the window ending 5 December 2019 to 0.79 in the one ending 3 October 2025. Here’s what that did to the number of bets:
In those windows since January 2015, seven dollar trades were worth 1.69 independent bets at the median and 2.69 at best, in December 2019. On 82% of days they were worth fewer than two. The three-pair basket of EURUSD, GBPUSD and short USDCHF never reached 1.8.
Our position: count every trade against the same currency as one bet first, size them as one, and only then look at a correlation table to see whether you can afford a little more. Reading the table first invites you to wait for a high number, and that number is built on the last four months.
the dollar was on one side of 89% of all foreign exchange trades in April 2025, according to the BIS Triennial Central Bank Survey published on 30 September 2025. Every major pair has the dollar on one side, so a basket of majors traded against it is a dollar position however many tickets it has.
EURUSD USDCHF correlation: where the formula misleads
The formula trusts the past, and a correlation over the last four months can sit at its strongest the day before it breaks. On 14 January 2015 the correlation of EURUSD and USDCHF over the previous 90 daily changes was −0.99, as close to a mirror as two pairs get. The franc was held to the euro by a floor, and the next day the floor was gone:
“The Swiss National Bank (SNB) is discontinuing the minimum exchange rate of CHF 1.20 per euro.”
Swiss National Bank, press release, Zurich, 15 January 2015
Between the two ECB fixings EURUSD fell 0.57% and USDCHF fell 13.91%. A trader holding long EURUSD against long USDCHF as a “hedge” had two legs that the table called opposite. Both lost, and in percentage terms the franc leg lost 24 times as much as the euro leg.
The other two traps are quieter. The formula assumes each stop sits at the same multiple of its pair’s volatility; a tight stop on one pair and a wide one on another put more weight on one leg than the sum of the cells shows. And our numbers come from one ECB fixing a day, taken around 14:10 CET. They say nothing about how the pairs move against each other in the hour your stops are hit.
That’s the boundary of what we measured: we couldn’t find a free, dated source of intraday correlation for the majors, so we don’t know whether the 0.84 holds, rises or falls inside the day.
Before you open the next trade against a currency you already hold:
- Add up the pairs that share that currency and count them as one position.
- Divide your normal risk by √(sum of the cells), or by the number of trades if you have no fresh matrix. Seven trades: √33.44 = 5.78, so 1% ÷ 5.78 = 0.17% each.
- Put the smaller risk and each stop into the lot size calculator and size every leg from it.
What is correlation in forex?
It’s the Pearson correlation of two pairs’ returns: how often, and by how much, they move up or down together. It’s measured on returns, not on price levels, because two prices that both drift for a year will look correlated even when their daily moves aren’t. At +1 the pairs move as one, at −1 as mirror images, and at 0 there’s no straight-line link.
The sign depends on how the pair is quoted. EURUSD and USDCHF show −0.84, but long one and short the other is the same dollar trade twice. VipTools doesn’t have a correlation matrix yet; until it does, the cells above are the ones we’d use for majors.
Back to the seven tickets. The risk column still shows seven lines of $100, and on the numbers from the past year they swing like one $578 bet against the dollar, while the loss if every stop is hit is still $700.
Size your next trade
Account, risk and stop in, position size out. Free, in your browser, no sign-up.