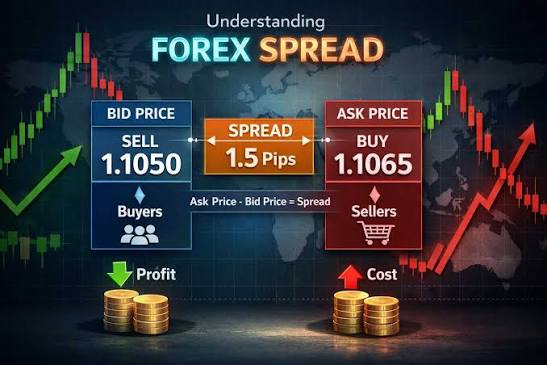
Published raw-account prices put the full trip in and out of EURUSD at 0.7 to 0.8 pips and gold’s at $0.15 to $0.70. From January to 8 October 2026, the euro took the bigger share of its daily range every day.
- Round turn in pips = spread + (per-side fee × 2) ÷ pip value of 1 lot in account currency. Tickmill’s typical 0.1-pip EURUSD quote plus a $6 fee is 0.7 pips, or $7 a lot.
- Gold’s total depends on which published figure you take: 0.09 plus the fee is $15 to $16 per contract, while IC Markets’ specification sheet average of 0.63 makes it $70.
- On 8 October 2026 the raw EURUSD cost of getting in and out was 1.16% of the pair’s 14-day average daily range; gold’s was 0.19% at 0.09 and 0.87% at 0.63.
- A no-commission quote of 1.4 pips on the pair, at another broker, costs $14 per position: 2.32% of the same range.
Getting in and out of EURUSD on a raw account costs $7 a lot and gold $15 to $70, yet on 8 October 2026 the cheaper euro trade took 1.16% of its average day and gold at most 0.87%. Forex spread cost is the gap you cross plus the fee you pay to open and close, expressed in pips: on the euro a 0.1-pip typical bid-ask and a $6 charge for both sides on a $10-a-pip contract come to 0.7. You close a 1-lot EURUSD scalp one pip in your favour, and the history tab shows $10.00 in the Profit column and −6.00 in the Commission column right next to it.
So the trade made $4. The bid-ask gap has no column; you paid it at the ask.
Gold charges the same −6.00 and at least twice as much in total. Why would the dearer trade hurt less?
How to calculate spread plus commission in pips
Convert the fee into pips with the pip value of 1 lot in account currency, then add the spread. Brokers quote it “per side”, and you pay it on the way in and again on the way out.
Tickmill’s raw account charges $3 per lot per side, with a typical EURUSD spread of 0.1: $6 for both legs, or 0.6 pips at $10 a pip, so the total is 0.7 and six-sevenths of it is the fee.
We measured each published round turn against the instrument’s average daily range, the mean of the last 14 highs minus lows, on 8 October 2026. Gold ranges come from COMEX gold futures (GC=F, via Yahoo Finance) as a proxy for spot XAUUSD.
| Account and instrument | Published quote | Fee, in and out | Round turn, 1 lot | Same, as price | Share of 14-day range, 8 Oct |
|---|---|---|---|---|---|
| Tickmill Raw, EURUSD | 0.1 pip typical | $6.00 | $7.00 | 0.7 pips | 1.16% |
| IC Markets Raw, EURUSD | 0.01 (table) or 0.1 (text) average | $7.00 | $7.10 to $8.00 | 0.71 to 0.8 pips | 1.18% to 1.32% |
| OANDA US spread-only, EURUSD | 1.4 pips listed | none | $14.00 | 1.4 pips | 2.32% |
| Tickmill Raw, XAUUSD | 0.09 typical | $6.00 | $15.00 | $0.15 | 0.19% |
| IC Markets Raw, XAUUSD | 0.09 (web table) or 0.63 (spec sheet) average | $7.00 | $16.00 to $70.00 | $0.16 to $0.70 | 0.20% to 0.87% |
Source: Tickmill raw account, spreads and instrument pages (“typical” spreads name no account type; gold fee inferred from “commissions only apply to CFDs on FX and Precious Metals”); IC Markets Global spreads pages and undated specification sheet; OANDA US pricing page; checked 9 October 2026. Calculation by VipTools.
Back to gold’s −6.00. Its average day on 8 October was $80.25, 535 times the $0.15 total cost and still 115 times the $0.70 one. The euro’s was 60.4 pips, 86 times its 0.7. Per lot, gold’s day was worth $8,025 against $604.
Which did you compare them by: the quoted spread, or the full cost against how far each price travels in a day?
Is the XAUUSD spread more expensive than EURUSD?
Per contract, always. Per unit of movement, it depends on the year and on which gold figure you believe. We held published costs fixed and let the market move the denominator:
At Tickmill’s typical spreads, the euro’s cost of getting in and out took more of its day than gold’s on all 431 trading days since January 2025: from 2.0x to 23.7x, median 8.2x. IC Markets’ web-table figures give 2.2x to 25.4x, median 8.8x.
At IC’s 0.63 spec-sheet average the picture splits. The pair was cheaper on 167 of 238 trading days in 2025, the last on 7 October 2025, and dearer on all 193 trading days of 2026 up to 8 October: 0.44x to 5.1x, median 1.76x, 1.33x on 8 October. Gold’s median 14-day range doubled from $54.53 in 2025 to $108.99 in 2026; the pair’s fell from 69.5 to 51.3 pips.
The same 0.7 is cheap at a 136-pip 14-day average range, the pair’s peak in late April 2025, and heavy at a 36-pip one, its low on 9 September 2026.
Put it on a stop. A 15-pip EURUSD stop and a $20 gold stop were each about a quarter of the day on 8 October. With $1,000 at risk:
- EURUSD on Tickmill’s raw account: 6.67 lots, total cost $46.67, which is 4.7% of the risk.
- The pair on OANDA US’s no-commission pricing: the same 6.67 lots cost $93.33, or 9.3%.
- Gold: 0.50 lot, $7.50 in and out at 0.09, or 0.8%; $35.00 at 0.63, or 3.5%.
Where we stand: compare instruments by round turn per day of range, never by the quoted spread. On that measure the euro was the costlier instrument on every trading day of 2026 up to 8 October, whichever gold figure you take. Rows 1 and 2 are a cross-broker comparison: OANDA US serves US residents and also offers core pricing plus commission, while Tickmill and IC Markets Global don’t take US clients.
Forex fees: what the spread formula leaves out
Forex fees on one trade are the spread, the per-side charge on both legs, swap if you hold past rollover and slippage when a stop fills. The formula on Tickmill’s spreads page covers only the first:
“Use this formula to calculate the cost of opening a trade: Trade Cost = Spread × Trade Size × Pip Value”
Tickmill, “Spreads and swaps” page, checked 9 October 2026
It’s correct for what it says. On Tickmill’s own raw account, though, the fee in and out is $6: six times the $1 a 0.1-pip quote costs on 1 lot of EURUSD. Where the short version misleads:
- Published is not your fill. IC gives averages, Tickmill “typical” spreads, OANDA a listed figure; none says over which hours. OANDA warns spreads widen around opens, closes and major events.
- Commission is per side. $3 looks like 0.3 pips; you pay it twice.
- Swaps and slippage. Neither is in any published spread.
- Account currency. IC charges a EUR account €3.25 per side; at the ECB rate of 1.1186 on 8 October a EURUSD pip on 1 lot was worth €8.94, so the fee alone was 0.73 pips.
IC Markets publishes two gold averages that disagree: 0.09 in the metals table on its spreads page, 0.63 in its undated commodity specification sheet. Its EURUSD row shows a raw average of 0.01 while its text says 0.1. At 0.63 the full trip in and out on gold is $70 per contract, not $16. Source: IC Markets Global spreads page and Commodity Specification Sheet, checked 9 October 2026.
Do you know whether the figure your broker publishes is measured across the whole day or only the liquid hours?
Forex spread calculator: which numbers to enter
A calculator that takes only the quote and position size gives the cost of opening. Feed it the round turn:
- Take the gap you see at the hour you trade, or the published one.
- Double the per-side fee and divide it by the pip value of 1 lot in account currency.
- Add the two and multiply by lots and pip value: that’s the trade’s cost in your account currency.
- Divide it by the money at risk to the stop, the same budget you size with in the lot size calculator. Over 5% on a euro scalp means the cost is a big piece of the plan.
The pip calculator gives step 2’s pip value of 1 lot, so the fee converts correctly on JPY or CHF pairs too. On gold, a 100-ounce contract moves $100 per $1.00.
What we couldn’t find: any broker on our list saying over which hours its published quote is measured, or how much spreads widen at rollover. Each figure in our table is an average, typical or listed figure, not a promise for your next fill.
What is spread in forex?
It’s the gap between bid and ask: you buy at the higher price and sell at the lower, so a new position starts behind by that amount. EURUSD quotes it in pips (0.0001), gold in dollars and cents.
On a spread-only account the fee sits inside that gap; on a raw account it arrives as commission. Add it back and 1.4 pips faces 0.7, not 0.1.
Back in your history tab, the Commission column on a 1-lot euro trade reads −6.00, and on a gold trade it reads −6.00 too. On the euro that line is six-sevenths of a cost that took 1.16% of a day’s move; on gold the whole cost of getting in and out took 0.87% at the dearest published spread.
Check the pip on your pair
Today’s pip value for any pair and account currency. Free, in your browser, no sign-up.